APAC Open Marketing Database

46Countries & territories
24Tables
2.10MRows (approx.)
72Sources

About this database

Explore population, household spending and market size for 46 Asia-Pacific countries and territories, with sources. Read topics, country figures and rankings on this page, then download the data free as CSV or SQLite.

There are 2,103,557 rows across 22 main tables and 2 city tables.

7,724States, provinces & districts
5,903Cities in Asia-Pacific
72Sources

Version 2026-10-12 · Free · No registration

Made by Atelier Factory. Data collected: September–October 2026. Data version: 2026-10-12. Page updated: 2026-10-14.

01

Data downloads

Data downloads

CSV and SQLite contain the same numbers in different file formats. City data is in separate files.

Countries, population, regions, spending and market size: 22 tables

CSV files are available for 38 countries and territories. Download only the country you need. Each file includes sources and terms of use.

Version 2026-10-12 · Free · No registration

CSV = one file per table. Open it in Excel.

Download CSV · 12 MB

SQLite = all tables in one file, for use in programs.

Download SQLite · 17 MB

City data

2 tables covering 11,422 cities worldwide, including 5,903 in Asia-Pacific. CSV and SQLite contain the same city figures.

Country CSV files

Opening and checking files

How to open the files

Main and city downloads are ZIP archives. Unzip them after downloading. CSV gives you a separate file for each table; SQLite gives you one file containing multiple tables.

If characters look wrong in Excel, import via Data → From Text/CSV and select UTF-8. Large tables may exceed the Excel row limit.

File checksums (SHA-256)

Use these values to check that a downloaded ZIP matches the distributed file.

aomd_2026-10-12.sqlite.zip96f2f150cf58eef0a94f8cf94e8605b5d966e75f0ef1e7a83dc487c0ec5d8a6d
aomd_2026-10-12_csv.zipe42950f9fc273887ebd1e8f6fde9a1faca20232e327bf6e91490c29507bfb3b6
aomd_2026-10-12_cities.sqlite.zip0311a3f6f215efa026d669673c546e4830c4e9af6456ba2468ae059a7ea7262a
aomd_2026-10-12_cities_csv.zipb978b72d886cf4b2cb7acfac518df8636c6b6f2916ed6c84539e958ef001b0ab
02

Data by topic

Data by topic

Six topics cover population and age, household spending, market size, products, cities, and regions. Each includes an overview, sample data and a table catalogue.

Population and age

Questions you can answer

  • How many people of each age live in each country
  • Where young people will increase or decrease in 10 years
  • Which countries have the most older people

A look inside

Top 5 and bottom 5 · Source:UN World Population Prospects 2024

Country/territoryChange in people aged 15–34 (2025→2035)
Mongolia+32.3%
Afghanistan+28.7%
Vanuatu+28.3%
Samoa+27.9%
Solomon Islands+27.5%
Macau-17.3%
South Korea-19.9%
Maldives-24.7%
Hong Kong-27.8%
Singapore-30.5%

Tables

Check sources in each table or its associated indicator and source catalogue.

TableRowsColumns
population_age108,720iso3, name_ja, year, age_band, pop_total, pop_male, pop_female, is_projection
country_latest2,299iso3, name_ja, indicator, indicator_ja, year, value, unit, source, source_code, is_projection

How to cite

Cite “APAC Open Marketing Database (aTELiER FACTORY)” and the source of the rows you used. Sources and methods

Household spending

Questions you can answer

  • Where households spend most on food
  • How much people spend per person
  • How spending differs between regions of the same country

A look inside

Top 10 · Source:Calculated (household consumption ÷ population)

Country/territoryHousehold consumption per person (international $)Year
Hong Kong51,7142025
Singapore40,8372025
Australia36,4752025
Macau35,2512025
New Zealand31,4682024
South Korea28,1262025
Japan27,3662024
Taiwan26,3402021
Malaysia24,2242025
Brunei23,4432025

Tables

Check sources in each table or its associated indicator and source catalogue.

TableRowsColumns
spending_structure3,648iso3, year, source, basis, coicop, coicop_ja, group6, share_pct, amount, currency, note, name_ja
spending_group61,842iso3, name_ja, year, source, basis, group6, share_pct
region_household_spending4,748iso3, adm1_id, adm1_name, region_name_source, match_how, survey, year, area, household_type, measure, currency, price_basis, group_level, group_code, group_codes_covered, group_match, group_name_coicop, group_name_source, value, share_pct, share_basis, total_value, comparable_across_countries, comparability_note, source_dataset, src_file, src_loc, src_value, note, source

How to cite

Cite “APAC Open Marketing Database (aTELiER FACTORY)” and the source of the rows you used. Sources and methods

Market size

Questions you can answer

  • How big is the market for a category
  • How countries compare
  • How each number was calculated (formula and inputs)

A look inside

Top 10 · Source:World Bank International Comparison Program (ICP 2021)

Country/territoryActual individual consumption, total (USD, 2021)
China8.0 trillion
China6.9 trillion
China6.0 trillion
Japan3.3 trillion
Japan2.7 trillion
Japan2.1 trillion
India2.1 trillion
India1.9 trillion
India1.8 trillion
Australia1.1 trillion

Tables

Check sources in each table or its associated indicator and source catalogue.

TableRowsColumns
market_size_household9,679layer, iso3, year, period_label, survey, source_dataset, source_table, household_scope, item_code, item_name, item_level, item_path, coicop2018_code, coicop2018_name_ja, coicop2018_match, value_lc, currency, value_usd, fx_lc_per_usd, formula, inputs, input_years, year_gap_note, comparable_across_countries, approx, approx_reason, note, source
market_size_icp1,860layer, iso3, year, icp_series, icp_series_name, scope, coicop2018_code, coicop2018_name_ja, coicop2018_match, value_ppp_intl_usd, value_usd, value_lc_icp_published, currency, population_used, formula, inputs, input_years, year_gap_note, comparable_across_countries, approx, approx_reason, note, source
market_size_retail1,139layer, iso3, year, source_dataset, measure, classification, industry_code, industry_name, isic4_code, isic4_match, sector, value_lc, currency, value_usd, fx_lc_per_usd, periods_summed, formula, inputs, input_years, year_gap_note, comparable_across_countries, approx, approx_reason, note, source

How to cite

Cite “APAC Open Marketing Database (aTELiER FACTORY)” and the source of the rows you used. Sources and methods

Consumers and products

Questions you can answer

  • Share of households that own a TV, fridge, motorbike or car
  • Share of people who shop online
  • Categories with rising interest

A look inside

Top 10 · Source:World Bank Global Findex

Country/territoryBought something online (age 15+)Year
South Korea77.9%2021
Australia77.4%2021
New Zealand76.8%2021
China74.4%2024
Hong Kong60.9%2021
Singapore58.4%2021
Taiwan56.1%2021
Malaysia54.0%2024
Mongolia53.6%2024
Japan52.5%2021

Tables

Check sources in each table or its associated indicator and source catalogue.

TableRowsColumns
category_involvement32,033iso3, category_id, measure, year, value, source, breakdown, note, category_ja, group_ja, country_ja
category_involvement_latest4,101iso3, category_id, measure, year, value, source, breakdown, note, category_ja, group_ja, country_ja
category_interest_monthly93,336lang, category_id, yyyymm, views, vpm
category_master57category_id, category_ja, group_ja, icp_series, dhs_indicators, findex_series, wiki_articles

How to cite

Cite “APAC Open Marketing Database (aTELiER FACTORY)” and the source of the rows you used. Sources and methods

Cities

Questions you can answer

  • The most populous cities in Asia
  • Cities that will grow
  • Comparing cities across borders with one definition

A look inside

Top 10 by population · Source:EU JRC GHSL Urban Centre Database

CityCountry/territoryPopulation (2025)10-year growth
GuangzhouChina43.0 million+9.8%
JakartaIndonesia40.5 million+14.3%
DhakaBangladesh37.3 million+23.1%
TokyoJapan33.2 million-0.1%
New DelhiIndia31.4 million+18.5%
ShanghaiChina30.7 million+27.2%
ManilaPhilippines25.9 million+14.8%
KolkataIndia23.3 million+7.4%
SeoulSouth Korea22.3 million+3.3%
KarachiPakistan21.0 million+36.3%

Tables

Check sources in each table or its associated indicator and source catalogue.

TableRowsColumns
cities11,422city_id, city_name, city_names_all, country_name, area_km2, pop_2025, income_group_wb, world_region, is_capital, iso3, lon, lat, in_apac, country_ja, pop_2030, pop_2015, pop_growth_2015_2025_pct, gdp_ppp_per_capita, hdi, pop_young_pct, pop_older_pct, places_total, source
city_panel889,315city_id, year, indicator, value, iso3, city_name, source

How to cite

Cite “APAC Open Marketing Database (aTELiER FACTORY)” and the source of the rows you used. Sources and methods

States, provinces and districts

Questions you can answer

  • How many people of each age live in each region
  • The latest census or official estimate
  • Where each number is written in the original file

A look inside

Countries with the latest regional population (top 10) · Source:National statistics offices

Country/territoryNumber of regions
Thailand77
Vietnam63
Japan47
China31
Cambodia25
Marshall Islands25
Mongolia22
Taiwan22
Bhutan20
Hong Kong18

Tables

Check sources in each table or its associated indicator and source catalogue.

TableRowsColumns
regions7,724iso3, level, region_code, region_name, parent_name, level_name_local, source, country_ja
region_population_latest27,692iso3, adm1_id, measure, sign, source_dataset, level, region_name_source, age_group, sex, value, unit, src_file, src_loc, src_value, source
region_population_age557,631iso3, level, region_code, year, sex, age_band, population, source
region_panel26,473iso3, level, region_code, year, source, pop_total, pop_0_14_pct, pop_15_34_pct, pop_35_64_pct, pop_65p_pct, region_name, parent_name, country_ja

How to cite

Cite “APAC Open Marketing Database (aTELiER FACTORY)” and the source of the rows you used. Sources and methods

03

Data by country and territory

Data by country and territory

Coverage and the latest year vary by country.

The download files also include the United States, the United Kingdom and the EU for comparison.

East Asia

China CHN

National figures

IndicatorValueYearSource
Population1.41 billion people2026UN World Population Prospects 2024
People aged 15–34338.70 million people2026UN World Population Prospects 2024
Median age40.65 years old2026UN World Population Prospects 2024
Share of people living in cities66.34 %2025World Bank WDI
Household consumption per 1 person (price-adjusted)10,692 International dollars2024Calculated
GDP per 1 person (price-adjusted)29,333 International dollars2025World Bank WDI
Total household consumption (price-adjusted)15.17 trillion International dollars2024World Bank WDI
Price level of everyday goods (world average =100)96.1 2021World Bank ICP
Inflation (1 year)0.06 %2025World Bank WDI
Economic growth (1 year)4.96 %2025World Bank WDI
Share of people using the internet91.6 %2025UN SDG
Share of people with an account or mobile money89.38 %2024World Bank WDI
International visitors5.66 million people2021Asian Development Bank KIDB
Income inequality (Gini coefficient)36 2022World Bank WDI
Unemployment rate4.62 %2025World Bank WDI

Figures by province (31 provinces, autonomous regions and municipalities)

Sorted by population. “―” means there is no figure, or the figure is not published here because its terms of use are unclear.

provinces, autonomous regions and municipalitiesPopulation
people · 2024
Population per 1km² (population density)
people/km² · 2024
Guangdong127.80 million710.0
Shandong100.80 million630.0
Henan97.85 million575.6
Jiangsu85.26 million852.6
Sichuan83.64 million170.7
Hebei73.78 million388.3
Zhejiang66.70 million667.0
Hunan65.39 million311.4
Anhui61.23 million437.4
Hubei58.34 million307.1
Guangxi50.13 million208.9
Yunnan46.55 million119.4
Jiangxi45.02 million264.8
Fujian41.93 million349.4
Liaoning41.55 million277.0
Shaanxi39.53 million188.2
Guizhou38.60 million214.4
Shanxi34.46 million215.4
Chongqing31.90 million387.3
Heilongjiang30.29 million65.8
Xinjiang26.23 million15.8
Shanghai County24.80 million3,912
Gansu24.58 million57.2
Inner Mongolia23.88 million20.2
Jilin23.17 million121.9
Beijing21.83 million1,330
Tianjin13.64 million1,143
Hainan10.48 million308.2
Ningxia7.29 million110.5
Qinghai5.93 million8.2
Tibet Autonomous Region3.70 million3.1

Current economy (monthly)

IndicatorLatest valueMonthSource
Business confidence (OECD, 100=long-term average)98.362026-08OECD
Consumer confidence (OECD, 100= long-term average)95.42026-07OECD
Inflation (compared with the same month a year earlier)0.512026-07World Bank
Unemployment rate (seasonally adjusted)3.932021-12World Bank

Culture

Religion (2020, Pew Research Center 2025「Religious Composition by Country, 2010-2020」): No religion (no particular faith) 89.6%, Buddhism 3.7%, Other religions (Sikhism, Taoism, Shinto, Jainism, Bahá'í, folk religions, etc.) 3%, Islam 1.8%, Christianity 1.8%

Source

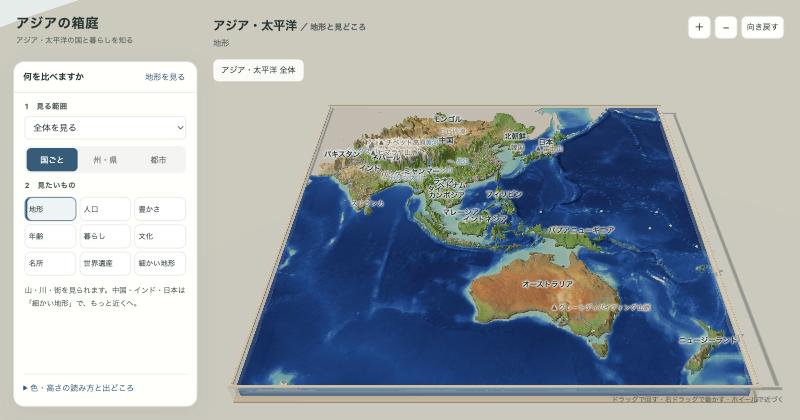
The figures on this page come from the following public statistics. On the 3D map, click a number to see, for each one, the URL of the original file, the location inside it, the text exactly as written, the date fetched, the file fingerprint (sha256), and for calculated numbers, the formula and inputs.

  • OECD (OECD terms of use (use permitted with attribution))
  • Pew Research Center 2025「Religious Composition by Country, 2010-2020」 (terms_attribution)
  • World Bank (CC BY 4.0)
  • Asian Development Bank KIDB (CC BY 3.0 IGO)
  • World Bank ICP (CC BY 4.0)
  • World Bank WDI (CC BY 4.0)
  • UN SDG (UN)
  • UN World Population Prospects 2024 (CC BY 3.0 IGO)
  • Calculated
Go to this country’s CSV

Japan JPN

National figures

IndicatorValueYearSource
Population122.43 million people2026UN World Population Prospects 2024
People aged 15–3423.94 million people2026UN World Population Prospects 2024
Median age50.18 years old2026UN World Population Prospects 2024
Share of people living in cities92.3 %2025World Bank WDI
Household consumption per 1 person (price-adjusted)27,366 International dollars2024Calculated
GDP per 1 person (price-adjusted)55,422 International dollars2025World Bank WDI
Total household consumption (price-adjusted)3.39 trillion International dollars2024World Bank WDI
Price level of everyday goods (world average =100)142.8 2021World Bank ICP
Inflation (1 year)3.17 %2025World Bank WDI
Economic growth (1 year)1.19 %2025World Bank WDI
Share of people using the internet85.5 %2024UN SDG
Share of people with an account or mobile money98.52 %2024World Bank WDI
International visitors36.87 million people2024Asian Development Bank KIDB
Income inequality (Gini coefficient)32.3 2020World Bank WDI
Unemployment rate2.5 %2025ILO

Current economy (monthly)

IndicatorLatest valueMonthSource
Business confidence (OECD, 100=long-term average)101.42026-06OECD
Consumer confidence (OECD, 100= long-term average)98.422026-08OECD
Inflation (compared with the same month a year earlier)1.92026-07World Bank
Retail sales value (year on year)3.692026-07estat_dashboard
Retail sales volume (year on year)16.662026-07OECD Short-term economic statistics DSD_STES@DF_INDSERV
Unemployment rate (seasonally adjusted)2.462026-06World Bank

Culture

Religion (2020, Pew Research Center 2025「Religious Composition by Country, 2010-2020」): No religion (no particular faith) 57.5%, Buddhism 37.2%, Other religions (Sikhism, Taoism, Shinto, Jainism, Bahá'í, folk religions, etc.) 2.9%, Christianity 2.2%, Islam 0.2%

Source

The figures on this page come from the following public statistics. On the 3D map, click a number to see, for each one, the URL of the original file, the location inside it, the text exactly as written, the date fetched, the file fingerprint (sha256), and for calculated numbers, the formula and inputs.

  • ILO (CC BY 4.0)
  • OECD (OECD Terms)
  • OECD Short-term economic statistics DSD_STES@DF_INDSERV (Production, sales, work started and orders) (OECD Terms and Conditions (free to use with source credited))
  • Pew Research Center 2025「Religious Composition by Country, 2010-2020」 (terms_attribution)
  • World Bank (CC BY 4.0)
  • estat_dashboard (Government Standard Terms of Use)
  • Asian Development Bank KIDB (CC BY 3.0 IGO)
  • World Bank ICP (CC BY 4.0)
  • World Bank WDI (CC BY 4.0)
  • UN SDG (UN)
  • UN World Population Prospects 2024 (CC BY 3.0 IGO)
  • Calculated
Go to this country’s CSV

South Korea KOR

National figures

IndicatorValueYearSource
Population51.60 million people2026UN World Population Prospects 2024
People aged 15–3411.94 million people2026UN World Population Prospects 2024
Median age46.19 years old2026UN World Population Prospects 2024
Share of people living in cities81.17 %2025World Bank WDI
Household consumption per 1 person (price-adjusted)28,126 International dollars2025Calculated
GDP per 1 person (price-adjusted)63,125 International dollars2025World Bank WDI
Total household consumption (price-adjusted)1.45 trillion International dollars2025World Bank WDI
Price level of everyday goods (world average =100)121.1 2021World Bank ICP
Inflation (1 year)2.12 %2025World Bank WDI
Economic growth (1 year)1.01 %2025World Bank WDI
Share of people using the internet97.9 %2024UN SDG
Share of people with an account or mobile money96.89 %2024World Bank WDI
International visitors18.94 million people2025Asian Development Bank KIDB
Income inequality (Gini coefficient)32.9 2021World Bank WDI
Unemployment rate2.79 %2025ILO

Figures by province and city (17 provinces and metropolitan cities)

Sorted by population. “―” means there is no figure, or the figure is not published here because its terms of use are unclear.

provinces and metropolitan citiesPopulation
people · 2026
Population per 1km² (population density)
people/km² · 2026
Share of people aged 0–14
% · 2025
Share of people aged 65+
% · 2025
Prosperity: gross household disposable income per 1 person
10,000 won/person per year (nominal) · 2024
Gyeonggi Province13.77 million1,34911.1917.022,791
Seoul9.28 million15,3358.3519.863,222
Busan3.23 million4,1859.3124.462,616
South Gyeongsang3.19 million302.710.5722.172,506
Incheon3.07 million2,86710.6418.162,687
North Gyeongsang2.49 million135.39.3226.122,486
Daegu Metropolitan Subway2.35 million1,56410.221.162,578
South Chungcheong2.14 million259.310.4921.822,561
South Jeolla1.77 million143.39.8527.372,680
North Jeolla1.72 million212.69.5825.372,613
North Chungcheong1.60 million216.210.1421.852,655
Gangwon Province1.51 million89.59.4325.672,524
Daejeon1.44 million2,67310.3418.312,875
Gwangju1.38 million2,76311.1417.952,778
Ulsan1.09 million1,02211.3917.833,112
Jeju Province662,681358.212.2419.042,461
Sejong390,738840.317.211.62,838

Current economy (monthly)

IndicatorLatest valueMonthSource
Business confidence (OECD, 100=long-term average)99.622026-08OECD
Consumer confidence (OECD, 100= long-term average)100.62026-08OECD
Inflation (compared with the same month a year earlier)2.82026-07World Bank
Retail sales volume (year on year)-3.012026-06World Bank
Unemployment rate (seasonally adjusted)2.82026-07World Bank

Culture

Religion (2020, Pew Research Center 2025「Religious Composition by Country, 2010-2020」): No religion (no particular faith) 48.3%, Christianity 32%, Buddhism 19%, Other religions (Sikhism, Taoism, Shinto, Jainism, Bahá'í, folk religions, etc.) 0.3%, Islam 0.3%

Source

The figures on this page come from the following public statistics. On the 3D map, click a number to see, for each one, the URL of the original file, the location inside it, the text exactly as written, the date fetched, the file fingerprint (sha256), and for calculated numbers, the formula and inputs.

  • ILO (CC BY 4.0)
  • OECD (OECD Terms)
  • Pew Research Center 2025「Religious Composition by Country, 2010-2020」 (terms_attribution)
  • World Bank (CC BY 4.0)
  • Asian Development Bank KIDB (CC BY 3.0 IGO)
  • World Bank ICP (CC BY 4.0)
  • World Bank WDI (CC BY 4.0)
  • Tables from national statistics offices and ministries (24 newly fetched datasets) and tables already in the warehouse (e-Stat, OpenDOSM, National Statistical Office of Thailand, Brunei DEPS, Pakistan Bureau of Statistics, OCHA common datasets, OECD regional database, Pacific Community)
  • Ministry of Data and Statistics (formerly Statistics Korea), Economic Statistics Bureau, Income Statistics Division “2024년 지역소득(잠정)” press release (2025-12-23) (Korea Open Government License (KOGL) Type 1 on the cover of the PDF (usable for commercial purposes and in modified form, with attribution))
  • UN SDG (UN)
  • UN World Population Prospects 2024 (CC BY 3.0 IGO)
  • Ministry of the Interior and Safety (Ministry of the Interior and Safety) resident registration population statistics. File data 15097972 on the Public Data Portal (data.go.kr) (Public Data Portal label “이용허락범위 제한 없음” (no restriction on the scope of permitted use))
  • Calculated
Go to this country’s CSV

North Korea PRK

National figures

IndicatorValueYearSource
Population26.63 million people2026UN World Population Prospects 2024
People aged 15–347.21 million people2026UN World Population Prospects 2024
Median age36.8 years old2026UN World Population Prospects 2024
Share of people living in cities64.19 %2025World Bank WDI
Share of people using the internet0 %2004World Bank WDI
Unemployment rate3.54 %2025World Bank WDI

Figures by state/province (11 states/provinces)

Sorted by population. “―” means there is no figure, or the figure is not published here because its terms of use are unclear.

states/provincesPopulation
people · 2008
Population per 1km² (population density)
people/km² · 2008
South Pyongan Province3.07 million265.0
Pyongyang3.02 million1,726
North Pyongan Province2.74 million216.1
North Hwanghae Province2.35 million227.5
South Hwanghae Province2.22 million263.2
Nampo983,660861.3
Chagang Province――
Kangwon Province――
North Hamgyong Province――
Ryanggang Province――
South Hamgyong Province――

Culture

Religion (2020, Pew Research Center 2025「Religious Composition by Country, 2010-2020」): No religion (no particular faith) 72.9%, Other religions (Sikhism, Taoism, Shinto, Jainism, Bahá'í, folk religions, etc.) 25.2%, Buddhism 1.5%, Christianity 0.4%, Islam 0%

Source

The figures on this page come from the following public statistics. On the 3D map, click a number to see, for each one, the URL of the original file, the location inside it, the text exactly as written, the date fetched, the file fingerprint (sha256), and for calculated numbers, the formula and inputs.

  • Pew Research Center 2025「Religious Composition by Country, 2010-2020」 (terms_attribution)
  • UN OCHA Humanitarian Data Exchange (Varies by dataset (mostly CC BY / CC BY-IGO). Check the dataset page before use.)
  • World Bank WDI (CC BY 4.0)
  • UN World Population Prospects 2024 (CC BY 3.0 IGO)
Go to this country’s CSV

Taiwan TWN

National figures

IndicatorValueYearSource
Population23.01 million people2026UN World Population Prospects 2024
People aged 15–344.98 million people2026UN World Population Prospects 2024
Median age45.41 years old2026UN World Population Prospects 2024
Share of people living in cities62 %2025Asian Development Bank KIDB
Household consumption per 1 person (price-adjusted)26,340 International dollars2021World Bank ICP
GDP per 1 person (price-adjusted)90,018 International dollars2025Asian Development Bank KIDB
Price level of everyday goods (world average =100)82.72 2021World Bank ICP
Inflation (1 year)1.66 %2025Asian Development Bank KIDB
Economic growth (1 year)8.68 %2025Asian Development Bank KIDB
Share of people using the internet96.7 %2024UN SDG
Share of people with an account or mobile money95.62 %2024UN SDG
International visitors8.57 million people2025Asian Development Bank KIDB
Income inequality (Gini coefficient)31.57 2021Asian Development Bank KIDB
Unemployment rate3.35 %2025Asian Development Bank KIDB

Figures by county and city (22 counties and cities)

Sorted by population. “―” means there is no figure, or the figure is not published here because its terms of use are unclear.

counties and citiesPopulation
people · 2026
Population per 1km² (population density)
people/km² · 2026
Share of people aged 0–14
% · 2026
Share of people aged 65+
% · 2026
Affluence: average disposable income per 1 household
New Taiwan dollars/household/year (nominal) · 2025
Share of household spending on food and non-alcoholic beverages
% · 2025
New Taipei City4.04 million1,96610.520.571.26 million12.9
Taichung County2.87 million1,29412.4717.941.22 million13.02
Kaohsiung County2.71 million917.010.621.351.21 million13.64
Taipei2.42 million8,91011.6724.761.55 million14.79
Taoyuan2.36 million1,93112.8117.281.28 million14.98
Tainan County1.85 million842.510.8721.071.04 million15.08
Changhua County1.20 million1,11811.1620.96922,37917.21
Pingtung County778,014280.39.8922.39965,46616.39
Yunlin County646,458500.810.3122.25935,70515.55
Hsinchu County598,316419.114.4715.471.57 million12.4
Miaoli County529,282290.811.0820.761.17 million17.15
Chiayi County469,622246.78.0624.74889,26020.79
Nantou County466,401113.69.9623.38916,28116.31
Hsinchu City455,7834,37614.8216.611.60 million15.59
Yilan County448,065209.010.7721.29997,16816.55
Keelung357,9052,6969.0723.01982,17914.83
Hualien County310,77767.110.4922.14900,80115
Chiayi City261,4534,35511.8920.431.21 million14.6
Taitung County207,62659.110.5921.43825,08516.98
Fujian137,208904.77.5420.37――
Penghu Islands106,529839.79.2621.74955,20520.11
Matsu Islands13,625473.19.0117.72――

Current economy (monthly)

IndicatorLatest valueMonthSource
Business conditions (national survey, 50 = neutral)55.62026-08National Development Council
Consumer confidence (national survey; scale differs by country)65.012026-08National Central University, Taiwan Economic Development Research Center
Inflation (compared with the same month a year earlier)2.542026-07World Bank
Retail sales value (year on year)4.812026-08Department of Statistics, Ministry of Economic Affairs
Unemployment rate (seasonally adjusted)3.332026-07World Bank

Culture

Religion (2020, Pew Research Center 2025「Religious Composition by Country, 2010-2020」): Other religions (Sikhism, Taoism, Shinto, Jainism, Bahá'í, folk religions, etc.) 51.7%, No religion (no particular faith) 23.1%, Buddhism 19.2%, Christianity 5.5%, Islam 0.5%

Languages (2020, Taiwan DGBAS (Directorate-General of Budget, Accounting and Statistics, Taiwan) 2020 Population and Housing Census Table 6): Chinese (Standard Mandarin) 66.4%, Taiwanese (Taiwanese Hokkien) 31.7%, Hakka 1.5%, Taiwanese Indigenous languages 0.2%, Other languages 0.2%

Source

The figures on this page come from the following public statistics. On the 3D map, click a number to see, for each one, the URL of the original file, the location inside it, the text exactly as written, the date fetched, the file fingerprint (sha256), and for calculated numbers, the formula and inputs.

  • Pew Research Center 2025「Religious Composition by Country, 2010-2020」 (terms_attribution)
  • World Bank (CC BY 4.0)
  • Asian Development Bank KIDB (CC BY 3.0 IGO)
  • World Bank ICP (CC BY 4.0)
  • Household Registration Department (Department of Household Registration, Ministry of the Interior): population statistics, quick download (Open Government Data License, version 1 (commercial use allowed with attribution))
  • Taiwan DGBAS (Directorate-General of Budget, Accounting and Statistics, Taiwan) 2020 Population and Housing Census Table 6 (open_licence)
  • Tables from national statistics offices and ministries (24 newly fetched datasets) and tables already in the warehouse (e-Stat, OpenDOSM, National Statistical Office of Thailand, Brunei DEPS, Pakistan Bureau of Statistics, OCHA common datasets, OECD regional database, Pacific Community)
  • National Development Council (survey by Chung-Hua Institution for Economic Research; Government Open Data Platform dataset 6100) (Open Government Data License, version 1 (cite the source))
  • National Central University, Taiwan Economic Development Research Center (No terms of use stated (public university material; cite the source))
  • UN SDG (UN)
  • UN World Population Prospects 2024 (CC BY 3.0 IGO)
  • Department of Statistics, Ministry of Economic Affairs (Government Open Data Platform dataset 16365) (Open Government Data License, version 1 (cite the source))
  • DGBAS, Executive Yuan, Survey of Family Income and Expenditure, “Table 2: Average family income and expenditure per household by region” (ROC year 114 = 2025)
  • DGBAS, Executive Yuan, Survey of Family Income and Expenditure (Government Open Data Platform dataset 9415) (Open Government Data License, version 1)
Go to this country’s CSV

Hong Kong HKG

National figures

IndicatorValueYearSource
Population7.38 million people2026UN World Population Prospects 2024
People aged 15–341.36 million people2026UN World Population Prospects 2024
Median age47.95 years old2026UN World Population Prospects 2024
Share of people living in cities100.0 %2025World Bank WDI
Household consumption per 1 person (price-adjusted)51,714 International dollars2025Calculated
GDP per 1 person (price-adjusted)80,423 International dollars2025World Bank WDI
Total household consumption (price-adjusted)382.48 billion International dollars2025World Bank WDI
Price level of everyday goods (world average =100)124.3 2021World Bank ICP
Inflation (1 year)1.44 %2025World Bank WDI
Economic growth (1 year)3.49 %2025World Bank WDI
Share of people using the internet95.8 %2024UN SDG
Share of people with an account or mobile money97.31 %2024World Bank WDI
International visitors23.19 million people2025Asian Development Bank KIDB
Unemployment rate3.65 %2025ILO

Figures by state/province (18 states/provinces)

Sorted by population. “―” means there is no figure, or the figure is not published here because its terms of use are unclear.

states/provincesPopulation
people · 2025
Population per 1km² (population density)
people/km² · 2025
Share of people aged 0–14
% · 2025
Share of people aged 65+
% · 2025
Prosperity: median monthly household income
Hong Kong dollars/household/month (nominal) · 2021
Sha Tin District687,30010,0029.8924.3628,870
Yuen Long District674,5004,87110.1419.6927,560
Kwun Tong663,20058,7949.0924.9522,000
Tuen Mun District538,7006,27510.2323.3925,040
Eastern503,00027,9608.2127.1632,000
Sai Kung District501,2003,86510.0220.2337,840
Kwai Tsing District484,90020,7768.9725.3223,740
Sham Shui Po District429,80045,91910.5222.7521,490
Kowloon City District421,60042,11810.0322.2530,010
Wong Tai Sin District401,80043,2047.9926.8823,520
North335,5002,45910.1922.3823,580
Tai Po District326,5002,39810.4123.8630,000
Tsuen Wan298,8004,82610.2422.2232,040
Yau Tsim Mong District296,80042,46110.1120.2826,080
Southern251,5006,4758.6724.5732,440
Central and Western229,00018,2479.1321.3545,040
Islands District196,0001,07511.0217.428,960
Wan Chai160,60015,2088.5323.2345,000

Current economy (monthly)

IndicatorLatest valueMonthSource
Business conditions (national survey, 50 = neutral)44.12026-08Census and Statistics Department (C&SD)
Inflation (compared with the same month a year earlier)1.652026-07World Bank
Retail sales volume (year on year)2.372026-07Census and Statistics Department (C&SD)
Unemployment rate (seasonally adjusted)3.632026-07World Bank

Culture

Religion (2020, Pew Research Center 2025「Religious Composition by Country, 2010-2020」): No religion (no particular faith) 71.4%, Christianity 18.7%, Buddhism 8.4%, Other religions (Sikhism, Taoism, Shinto, Jainism, Bahá'í, folk religions, etc.) 0.9%, Hinduism 0.3%

Languages (2021, Census and Statistics Department, Hong Kong: 2021 Population Census, Table A207): Cantonese 88.2%, English 4.6%, Chinese (Standard Mandarin, Putonghua) 2.3%, Other languages 2%, Hokkien (Min Nan) 0.8%

Source

The figures on this page come from the following public statistics. On the 3D map, click a number to see, for each one, the URL of the original file, the location inside it, the text exactly as written, the date fetched, the file fingerprint (sha256), and for calculated numbers, the formula and inputs.

  • Census and Statistics Department (C&SD), Hong Kong SAR
  • Census and Statistics Department, Hong Kong (2021 Population Census) (Hong Kong Open Data (free to use with source credited))
  • Census and Statistics Department (C&SD) (Hong Kong Open Data)
  • ILO (CC BY 4.0)
  • Pew Research Center 2025「Religious Composition by Country, 2010-2020」 (terms_attribution)
  • World Bank (CC BY 4.0)
  • Asian Development Bank KIDB (CC BY 3.0 IGO)
  • World Bank ICP (CC BY 4.0)
  • World Bank WDI (CC BY 4.0)
  • Tables from national statistics offices and ministries (24 newly fetched datasets) and tables already in the warehouse (e-Stat, OpenDOSM, National Statistical Office of Thailand, Brunei DEPS, Pakistan Bureau of Statistics, OCHA common datasets, OECD regional database, Pacific Community)
  • UN SDG (UN)
  • UN World Population Prospects 2024 (CC BY 3.0 IGO)
  • Calculated
  • Census and Statistics Department, Hong Kong: 2021 Population Census, Table A207 (terms_attribution)
Go to this country’s CSV

Mongolia MNG

National figures

IndicatorValueYearSource
Population3.56 million people2026UN World Population Prospects 2024
People aged 15–341.02 million people2026UN World Population Prospects 2024
Median age26.97 years old2026UN World Population Prospects 2024
Share of people living in cities71.15 %2025World Bank WDI
Household consumption per 1 person (price-adjusted)11,150 International dollars2025Calculated
GDP per 1 person (price-adjusted)20,798 International dollars2025World Bank WDI
Total household consumption (price-adjusted)39.22 billion International dollars2025World Bank WDI
Price level of everyday goods (world average =100)46.05 2021World Bank ICP
Inflation (1 year)8.61 %2025World Bank WDI
Economic growth (1 year)6.84 %2025World Bank WDI
Share of people using the internet85.1 %2024UN SDG
Share of people with an account or mobile money98.28 %2024World Bank WDI
International visitors847,000 people2025Asian Development Bank KIDB
Income inequality (Gini coefficient)31.4 2022World Bank WDI
Unemployment rate5.41 %2025ILO

Figures by province (22 provinces)

Sorted by population. “―” means there is no figure, or the figure is not published here because its terms of use are unclear.

provincesPopulation
people · 2025
Population per 1km² (population density)
people/km² · 2025
Share of people aged 0–14
% · 2025
Share of people aged 65+
% · 2025
Prosperity: gross regional product per 1 person
thousand tugriks/person per year (nominal) · 2025
Share of household spending on food and non-alcoholic beverages
% · 2025
Ulaanbaatar1.67 million355.731.985.937,46117.88
Khövsgöl Province135,6001.329.85.939,730―
Övörkhangai Province113,4861.829.926.1711,673―
Bayan-Ölgii Province109,0382.435.574.478,425―
Orkhon Province106,356126.030.736.1538,806―
Darkhan-Uul Province105,12232.131.036.6212,422―
Selenge Province103,8312.528.666.718,335―
To'v92,9481.328.677.4314,560―
Arxangai91,1381.629.776.2512,302―
Khovd Province89,9661.233.025.1717,135―
Bayankhongor Province87,9740.831.35.4510,270―
Uvs Province84,1401.232.634.7410,109―
Dornod Province83,8590.731.516.1314,021―
Province of Umnugobi80,0050.531.894.6944,274―
Khentii Province78,792130.126.5511,108―
Dornogovi Province73,9700.729.225.1913,785―
Zavkhan Province70,0320.828.236.5310,724―
Sükhbaatar Province66,4410.831.45.7610,001―
Bulgan Province59,1101.227.527.8112,801―
Govi-Altai Province56,0910.429.015.7511,768―
Dundgovi Province45,8770.628.917.4114,364―
Govisümber Province18,1073.333.145.1613,432―

Current economy (monthly)

IndicatorLatest valueMonthSource
Inflation (compared with the same month a year earlier)13.112026-07World Bank
Wholesale and retail sales (value, vs. same month a year earlier)10.112026-07National Statistics Office of Mongolia

Culture

Religion (2020, UNdata UN Demographic Yearbook: population by religion (census)): Buddhism 51.8%, No religion 40.6%, Islam 3.2%, Shamanism 2.5%, Christianity 1.3%

Source

The figures on this page come from the following public statistics. On the 3D map, click a number to see, for each one, the URL of the original file, the location inside it, the text exactly as written, the date fetched, the file fingerprint (sha256), and for calculated numbers, the formula and inputs.

  • ILO (CC BY 4.0)
  • National Statistics Office of Mongolia 1212.mn PxWeb table DT_NSO_1900_002V2 (MONTHLY AVERAGE EXPENDITURE PER HOUSEHOLD, by region) (Public statistics of 1212.mn (cite the source as “National Statistics Office of Mongolia”). The terms-of-use page has not been checked)
  • National Statistics Office of Mongolia (1212.mn PxWeb, table DT_NSO_1600_002V1_month) (NSO Mongolia (credit the source))
  • National Statistics Office of Mongolia (1212.mn PxWeb) (NSO Mongolia (free to use with source credited))
  • National Statistics Office of Mongolia (data.1212.mn PxWeb) (CC BY 4.0 (1212.mn. Commercial use permitted, cite the source))
  • UNdata UN Demographic Yearbook: population by religion (census) (terms_attribution)
  • World Bank (CC BY 4.0)
  • Asian Development Bank KIDB (CC BY 3.0 IGO)
  • World Bank ICP (CC BY 4.0)
  • World Bank WDI (CC BY 4.0)
  • Tables from national statistics offices and ministries (24 newly fetched datasets) and tables already in the warehouse (e-Stat, OpenDOSM, National Statistical Office of Thailand, Brunei DEPS, Pakistan Bureau of Statistics, OCHA common datasets, OECD regional database, Pacific Community)
  • UN SDG (UN)
  • UN World Population Prospects 2024 (CC BY 3.0 IGO)
  • Calculated
Go to this country’s CSV

Macau MAC

National figures

IndicatorValueYearSource
Population723,188 people2026UN World Population Prospects 2024
People aged 15–34172,418 people2026UN World Population Prospects 2024
Median age40.27 years old2026UN World Population Prospects 2024
Share of people living in cities100.0 %2025World Bank WDI
Household consumption per 1 person (price-adjusted)35,251 International dollars2025Calculated
GDP per 1 person (price-adjusted)137,031 International dollars2025World Bank WDI
Total household consumption (price-adjusted)25.45 billion International dollars2025World Bank WDI
Inflation (1 year)0.33 %2025World Bank WDI
Economic growth (1 year)4.67 %2025World Bank WDI
Share of people using the internet89.8 %2024UN SDG
International visitors5.90 million people2020World Bank WDI
Unemployment rate2.35 %2025World Bank WDI

Culture

Religion (2020, Pew Research Center 2025「Religious Composition by Country, 2010-2020」): No religion (no particular faith) 67.6%, Buddhism 19.6%, Christianity 10.1%, Other religions (Sikhism, Taoism, Shinto, Jainism, Bahá'í, folk religions, etc.) 2.2%, Islam 0.5%

Languages (2021, Macao Statistics and Census Service, 2021 population census (district × language usually spoken at home)): Cantonese 81%, Other Chinese dialects 5.4%, Chinese (Standard Mandarin) 4.7%, English 3.6%, Tagalog 2.9%

Source

The figures on this page come from the following public statistics. On the 3D map, click a number to see, for each one, the URL of the original file, the location inside it, the text exactly as written, the date fetched, the file fingerprint (sha256), and for calculated numbers, the formula and inputs.

  • Pew Research Center 2025「Religious Composition by Country, 2010-2020」 (terms_attribution)
  • Macao Statistics and Census Service, 2021 population census (district × language usually spoken at home) (terms_attribution)
  • World Bank WDI (CC BY 4.0)
  • UN SDG (UN)
  • UN World Population Prospects 2024 (CC BY 3.0 IGO)
  • Calculated
Go to this country’s CSV

Southeast Asia

Indonesia IDN

National figures

IndicatorValueYearSource
Population287.89 million people2026UN World Population Prospects 2024
People aged 15–3489.40 million people2026UN World Population Prospects 2024
Median age30.66 years old2026UN World Population Prospects 2024
Share of people living in cities59.39 %2025World Bank WDI
Household consumption per 1 person (price-adjusted)9,089 International dollars2025Calculated
GDP per 1 person (price-adjusted)17,660 International dollars2025World Bank WDI
Total household consumption (price-adjusted)2.60 trillion International dollars2025World Bank WDI
Price level of everyday goods (world average =100)53.97 2021World Bank ICP
Inflation (1 year)1.91 %2025World Bank WDI
Economic growth (1 year)5.11 %2025World Bank WDI
Share of people using the internet72.8 %2024UN SDG
Share of people with an account or mobile money56.33 %2024World Bank WDI
International visitors13.60 million people2024Asian Development Bank KIDB
Income inequality (Gini coefficient)34.4 2025World Bank WDI
Unemployment rate3.24 %2025World Bank WDI

Figures by state (34 states)

Sorted by population. “―” means there is no figure, or the figure is not published here because its terms of use are unclear.

statesAffluence: gross regional product per 1 person
Rupiah/person per year (nominal) · 2025
Jakarta367.69 million
East Kalimantan208.33 million
North Kalimantan208.21 million
Riau176.38 million
Kepulauan Riau172.46 million
Central Sulawesi131.64 million
West Papua98.87 million
North Maluku97.26 million
Jambi92.79 million
Central Kalimantan84.73 million
Papua84.31 million
East Java80.86 million
South Sumatra80.66 million
South Sulawesi78.75 million
North Sumatra78.31 million
Bangka Belitung Islands75.32 million
North Sulawesi75.23 million
Banten74.67 million
Bali72.66 million
Southeast Sulawesi72.03 million
South Kalimantan70.58 million
West Java59.86 million
West Sumatra59.55 million
West Kalimantan56.98 million
Yogyakarta55.04 million
Lampung55.01 million
Bengkulu52.30 million
Central Java50.82 million
Gorontalo47.48 million
West Sulawesi46.65 million
Aceh45.77 million
West Nusa Tenggara33.67 million
Maluku33.65 million
East Nusa Tenggara25.84 million

Current economy (monthly)

IndicatorLatest valueMonthSource
Business confidence (OECD, 100=long-term average)992026-06OECD
Consumer confidence (OECD, 100= long-term average)100.72026-07OECD
Consumer confidence (national survey; scale differs by country)118.52026-08Bank Indonesia (Survei Penjualan Eceran, Survei Konsumen)
Inflation (compared with the same month a year earlier)2.892026-07World Bank
Retail sales volume (year on year)1.172026-07Bank Indonesia (Survei Penjualan Eceran, Survei Konsumen)

Culture

Languages (2010, UNdata UN Demographic Yearbook: population by language (census)): Javanese 31.9%, Other languages 20.9%, Indonesian 20%, Sundanese 15.2%, Madurese 3.6%

Source

The figures on this page come from the following public statistics. On the 3D map, click a number to see, for each one, the URL of the original file, the location inside it, the text exactly as written, the date fetched, the file fingerprint (sha256), and for calculated numbers, the formula and inputs.

  • Bank Indonesia (Survei Penjualan Eceran, Survei Konsumen) (Bank Indonesia (credit the source))
  • OECD (OECD terms of use (use permitted with attribution))
  • UNdata UN Demographic Yearbook: population by language (census) (terms_attribution)
  • World Bank (CC BY 4.0)
  • Asian Development Bank KIDB (CC BY 3.0 IGO)
  • World Bank ICP (CC BY 4.0)
  • World Bank WDI (CC BY 4.0)
  • UN SDG (UN)
  • UN World Population Prospects 2024 (CC BY 3.0 IGO)
  • Calculated
Go to this country’s CSV

Philippines PHL

National figures

IndicatorValueYearSource
Population117.72 million people2026UN World Population Prospects 2024
People aged 15–3442.49 million people2026UN World Population Prospects 2024
Median age26.57 years old2026UN World Population Prospects 2024
Share of people living in cities55.77 %2025World Bank WDI
Household consumption per 1 person (price-adjusted)8,925 International dollars2025Calculated
GDP per 1 person (price-adjusted)12,577 International dollars2025World Bank WDI
Total household consumption (price-adjusted)1.04 trillion International dollars2025World Bank WDI
Price level of everyday goods (world average =100)62.13 2021World Bank ICP
Inflation (1 year)1.66 %2025World Bank WDI
Economic growth (1 year)4.4 %2025World Bank WDI
Share of people using the internet67.3 %2024UN SDG
Share of people with an account or mobile money50.18 %2024World Bank WDI
International visitors5.95 million people2024Asian Development Bank KIDB
Income inequality (Gini coefficient)39.3 2023World Bank WDI
Unemployment rate2.23 %2025World Bank WDI

Figures by region (17 regions)

Sorted by population. “―” means there is no figure, or the figure is not published here because its terms of use are unclear.

regionsPopulation
people · 2024
Population per 1km² (population density)
people/km² · 2024
Share of people aged 0–14
% · 2024
Share of people aged 65+
% · 2024
Prosperity: average annual family (household) income
Pesos/family per year (nominal) · 2023
Share of household spending on food and non-alcoholic beverages
% · 2023
Calabarzon16.93 million1,02224.616.2426,53039
Metro Manila14.00 million22,60023.466.32513,52037.7
Central Luzon12.99 million592.925.146.72375,24040.4
Central Visayas8.24 million519.226.177.05316,60941.81
Western Visayas8.17 million393.125.178.25297,96342.72
Bicol Region6.06 million334.829.726.97287,47043
ARMM5.48 million149.437.542.54206,88057.5
Davao Region5.39 million263.826.66.56318,95039.7
Ilocos Region5.34 million412.123.688.71339,69043.1
Northern Mindanao5.18 million253.129.466.03296,50041.2
Soccsksargen4.68 million205.329.535.56282,44043.2
Eastern Visayas4.63 million199.128.527.49267,33044.5
Zamboanga Peninsula3.94 million233.329.636.25257,14045.7
Cagayan Valley3.78 million126.625.187.62310,55042.1
Mimaropa3.25 million109.629.66.51267,36042.1
Caraga2.87 million135.729.476.57276,57045.2
CAR1.81 million91.324.837.09359,24039.3

Current economy (monthly)

IndicatorLatest valueMonthSource
Inflation (compared with the same month a year earlier)6.262026-07World Bank
Unemployment rate (seasonally adjusted)4.72026-06World Bank

Culture

Religion (2020, Philippine Statistics Authority, 2020 census, religion (table re-compiled by the US Census Bureau on HDX)): Christian: Roman Catholic, excluding Catholic Charismatics 78.8%, Islam 6.4%, Iglesia ni Cristo 2.6%, Other religions: Other religious affiliations 1.7%, Seventh-day Adventist 0.8%

Languages (1995, UNdata UN Demographic Yearbook: population by language (census)): Tagalog 29.3%, Cebuano 21.2%, Ilocano 9.3%, (no name) 9.1%, Bikol 5.7%

Source

The figures on this page come from the following public statistics. On the 3D map, click a number to see, for each one, the URL of the original file, the location inside it, the text exactly as written, the date fetched, the file fingerprint (sha256), and for calculated numbers, the formula and inputs.

  • Philippine Statistics Authority (PSA) OpenSTAT (PSA terms of use (reusable with attribution; Terms of Use at https://psa.gov.ph/))
  • Philippine Statistics Authority OpenSTAT (PSA Open Data)
  • UNdata UN Demographic Yearbook: population by language (census) (terms_attribution)
  • World Bank (CC BY 4.0)
  • Asian Development Bank KIDB (CC BY 3.0 IGO)
  • Philippine Statistics Authority, 2020 census, religion (table re-compiled by the US Census Bureau on HDX) (open_licence)
  • World Bank ICP (CC BY 4.0)
  • World Bank WDI (CC BY 4.0)
  • Tables from national statistics offices and ministries (24 newly fetched datasets) and tables already in the warehouse (e-Stat, OpenDOSM, National Statistical Office of Thailand, Brunei DEPS, Pakistan Bureau of Statistics, OCHA common datasets, OECD regional database, Pacific Community)
  • UN SDG (UN)
  • UN World Population Prospects 2024 (CC BY 3.0 IGO)
  • Calculated
Go to this country’s CSV

Vietnam VNM

National figures

IndicatorValueYearSource
Population102.18 million people2026UN World Population Prospects 2024
People aged 15–3428.33 million people2026UN World Population Prospects 2024
Median age33.9 years old2026UN World Population Prospects 2024
Share of people living in cities38.83 %2025World Bank WDI
Household consumption per 1 person (price-adjusted)9,341 International dollars2025Calculated
GDP per 1 person (price-adjusted)18,088 International dollars2025World Bank WDI
Total household consumption (price-adjusted)949.05 billion International dollars2025World Bank WDI
Price level of everyday goods (world average =100)46.36 2021World Bank ICP
Inflation (1 year)3.31 %2025World Bank WDI
Economic growth (1 year)8.02 %2025World Bank WDI
Share of people using the internet84.2 %2024UN SDG
Share of people with an account or mobile money70.55 %2024World Bank WDI
International visitors21.17 million people2025Asian Development Bank KIDB
Income inequality (Gini coefficient)36.1 2022World Bank WDI
Unemployment rate1.52 %2025World Bank WDI

Figures by province (63 provinces)

Sorted by population. “―” means there is no figure, or the figure is not published here because its terms of use are unclear.

provincesShare of people aged 0–14
% · 2024
Share of people aged 65+
% · 2024
Lai Châu32.224.04
Điện Biên31.834.77
Kon Tum30.645.11
Hà Giang30.25.49
Sơn La29.25.43
Đắk Nông29.134.82
Lào Cai28.845.71
Gia Lai28.65.75
Yên Bái27.547.78
Nghệ An27.179.6
Bắc Ninh26.788.1
Vĩnh Phúc26.469.59
Tuyên Quang26.118.65
Hà Tĩnh26.1112.59
Đắk Lắk26.047.03
Bắc Giang25.79.17
Quảng Bình25.6510.08
Ninh Bình25.4712.3
Quảng Trị25.3910.77
Cao Bằng25.38.44
Phú Thọ25.2410.75
Bình Phước25.117.04
Hanoi24.969.67
Thanh Hóa24.9211.25
Thái Nguyên24.849.28
Ninh Thuận24.557.75
Hưng Yên24.4911.56
Hòa Bình24.498.85
Lâm Đồng24.497.54
Hải Dương24.3912.31
Quảng Ninh24.269.62
Hà Nam24.2312.89
Nam Định24.0814.82
Lạng Sơn23.888.52
Bắc Kạn23.848.43
Da Nang23.667.43
Quảng Nam23.5511.53
Hai Phong city23.3711.91
Huế23.2910.61
Đồng Nai23.187.11
Bình Thuận22.968.34
Bà Rịa-Vũng Tàu22.458.57
Quảng Ngãi22.3811.63
Phu Yen22.39.74
Thái Bình22.0115.17
Bình Định21.8811.36
Trà Vinh21.2911.38
Khánh Hòa21.249.01
Kiên Giang20.828.8
Sóc Trăng20.7611.65
Cà Mau20.7510.19
An Giang20.6610.69
Bình Dương20.643.87
Hậu Giang20.1211.59
Long An19.359.67
Dong Thap19.1811.02
Bạc Liêu19.159.81
Tây Ninh19.039.37
Ho Chi Minh City18.87.37
Tiền Giang18.7211.31
Can Tho city18.619.61
Vĩnh Long18.5912.61
Bến Tre18.1612.97

Current economy (monthly)

IndicatorLatest valueMonthSource
Inflation (compared with the same month a year earlier)4.482026-07World Bank
Unemployment rate (seasonally adjusted)2.212025-12World Bank

Culture

Religion (2020, Pew Research Center 2025「Religious Composition by Country, 2010-2020」): No religion (no particular faith) 67.7%, Buddhism 23%, Christianity 8.3%, Other religions (Sikhism, Taoism, Shinto, Jainism, Bahá'í, folk religions, etc.) 0.9%, Islam 0.1%

Source

The figures on this page come from the following public statistics. On the 3D map, click a number to see, for each one, the URL of the original file, the location inside it, the text exactly as written, the date fetched, the file fingerprint (sha256), and for calculated numbers, the formula and inputs.

  • Pew Research Center 2025「Religious Composition by Country, 2010-2020」 (terms_attribution)
  • World Bank (CC BY 4.0)
  • Asian Development Bank KIDB (CC BY 3.0 IGO)
  • World Bank ICP (CC BY 4.0)
  • World Bank WDI (CC BY 4.0)
  • Tables from national statistics offices and ministries (24 newly fetched datasets) and tables already in the warehouse (e-Stat, OpenDOSM, National Statistical Office of Thailand, Brunei DEPS, Pakistan Bureau of Statistics, OCHA common datasets, OECD regional database, Pacific Community)
  • UN SDG (UN)
  • UN World Population Prospects 2024 (CC BY 3.0 IGO)
  • Calculated
Go to this country’s CSV

Thailand THA

National figures

IndicatorValueYearSource
Population71.56 million people2026UN World Population Prospects 2024
People aged 15–3418.77 million people2026UN World Population Prospects 2024
Median age40.98 years old2026UN World Population Prospects 2024
Share of people living in cities62.8 %2025World Bank WDI
Household consumption per 1 person (price-adjusted)14,602 International dollars2025Calculated
GDP per 1 person (price-adjusted)26,250 International dollars2025World Bank WDI
Total household consumption (price-adjusted)1.05 trillion International dollars2025World Bank WDI
Price level of everyday goods (world average =100)53.73 2021World Bank ICP
Inflation (1 year)-0.13 %2025World Bank WDI
Economic growth (1 year)2.44 %2025World Bank WDI
Share of people using the internet90.9 %2024UN SDG
Share of people with an account or mobile money91.83 %2024World Bank WDI
International visitors32.97 million people2025Asian Development Bank KIDB
Income inequality (Gini coefficient)33.3 2024World Bank WDI
Unemployment rate0.6 %2025ILO

Figures by province (77 provinces)

Sorted by population. “―” means there is no figure, or the figure is not published here because its terms of use are unclear.

provincesPopulation
people · 2025
Population per 1km² (population density)
people/km² · 2025
Share of people aged 0–14
% · 2025
Share of people aged 65+
% · 2025
Prosperity: average monthly household income
Baht/household per month (nominal) · 2023
Share of household spending on food and non-alcoholic beverages
% · 2024
Bangkok9.12 million5,82613.3210.7840,05136.84
Nakhon Ratchasima2.48 million121.017.1516.7427,77540.76
Samut Prakan2.44 million2,43010.3410.8532,26339.09
Chon Buri2.09 million480.015.9510.1735,98135.51
Nonthaburi1.92 million3,08710.210.5536,76737.92
Pathum Thani1.92 million1,25710.1610.2945,72935.64
Chiang Mai1.78 million88.614.4118.0829,25241.38
Songkhla1.73 million233.419.9111.8123,93340.23
Ubon Ratchathani1.72 million109.217.2816.8420,31742.34
Khon Kaen1.70 million156.017.2216.8119,32643.2
Nakhon Si Thammarat1.54 million154.520.3712.0733,41436.71
Nakhon Pathom1.29 million593.610.169.9732,69237.83
Udon Thani1.24 million105.417.216.8321,21240.29
Rayong1.18 million333.616.419.3133,22634.99
Surat Thani1.18 million91.819.5811.1633,52337.79
Buriram1.17 million112.917.2816.8621,96137.8
Chiang Rai1.12 million9614.5618.7415,74543.26
Samut Sakhon1.12 million1,2848.798.5127,90543.47
Roi Et1.03 million123.617.316.8720,35433.72
Surin1.02 million124.917.2816.8322,21641.08
Chachoengsao976,208182.416.169.2529,14638.82
Phra Nakhon Si Ayutthaya921,890360.613.5214.7133,91939.98
Chaiyaphum904,02070.717.2816.8522,77846.03
Si Sa Ket900,053101.817.2816.8519,85841.78
Sakon Nakhon897,76493.517.2816.8520,65246.68
Phitsanulok889,19182.214.2919.0526,22536.05
Phetchabun885,59369.914.2718.9827,71738.53
Nakhon Sawan879,32791.614.2819.0223,13939.47
Suphan Buri842,649157.315.7116.2421,54238.26
Kanchanaburi833,77942.815.7716.0124,72341.95
Ratchaburi809,479155.815.4315.631,36834.67
Kamphaeng Phet777,54890.314.319.0122,44237.96
Kalasin770,194110.917.2816.8520,60044.96
Saraburi769,036215.013.914.8633,89439.92
Lopburi766,610123.713.9315.0525,91839.63
Maha Sarakham751,477142.017.2916.8521,16940.14
Narathiwat746,019166.720.512.2418,33344.14
Sa Kaeo692,03596.217.210.3421,21141.62
Prachin Buri682,678143.316.9410.4423,88339.74
Lampang676,2335414.319.0524,03941.18
Pattani653,954337.020.412.1519,77748.91
Trang634,792129.120.2411.9628,28840.29
Phuket624,5111,15019.1811.3241,86538.13
Sukhothai599,33790.914.3219.1126,85738.82
Chanthaburi582,7999217.1510.1643,85733.25
Tak536,80232.714.618.3422,64740.78
Nakhon Phanom530,68196.317.2616.8422,09941.04
Loei529,60746.417.1716.823,76646.16
Phetchaburi503,81580.915.4515.728,82342.59
Chumphon502,55983.619.8111.1232,32442.38
Phichit494,263109.114.1918.8422,92750.95
Phatthalung490,776143.320.512.2426,29041.87
Yala488,971108.220.4912.2126,75941.17
Prachuap Khiri Khan484,90076.215.9315.4126,01041.13
Nong Bua Lamphu464,319120.317.2816.8624,49138.63
Nong Khai454,534150.117.0216.6926,20139.25
Mukdahan440,275101.417.2716.8424,92546.34
Krabi439,15593.319.9811.6828,36037.28
Yasothon436,051104.817.2816.8624,43948.28
Nan430,48937.514.3119.1120,37641.86
Phayao430,4896814.3119.1117,39145.76
Uttaradit390,08249.814.3119.1124,94140.82
Lamphun383,1458514.5818.1125,53541.85
Bueng Kan353,32882.117.2716.8125,13744.92
Phrae352,47253.914.2919.0725,29039.91
Satun304,158122.720.3912.1323,44844.07
Ranong299,90990.920.210.726,73937.61
Trat285,072101.117.3810.3331,52134.71
Chai Nat283,949115.014.0215.2827,54340.4
Nakhon Nayok267,415126.016.8810.3324,99341.7
Uthai Thani264,47439.314.319.0820,60839.75
Phang Nga247,27359.320.2311.2522,14340.33
Mae Hong Son246,97519.514.6418.7118,50944.35
Ang Thong240,935248.813.9915.2227,92343.29
Sing Buri180,536219.513.9715.230,86938.11
Samut Songkhram172,837414.815.4215.3527,86939.6
Amnat Charoen97,40030.817.2816.8528,51543.91

The provincial “share aged 0–14” and “share aged 65+” are calculated from the counts in the original table (National Statistical Office of Thailand SFD_ADD_0403_01_0002_01, July 2025, province × single year of age × sex). In that table, provinces in the same region have almost the same age profile (for example, provinces in the Northeast are about 17.3% aged 0–14). The table does not explain how it was made; it appears to be an estimate that assigns a regional age profile to each province. Take care when reading age differences between provinces.

Current economy (monthly)

IndicatorLatest valueMonthSource
Business conditions (national survey, 50 = neutral)48.122026-09Bank of Thailand (Bank of Thailand)
Consumer confidence (national survey; scale differs by country)49.52026-08Ministry of Commerce (Thailand) Trade Policy and Strategy Office (TPSO)
Inflation (compared with the same month a year earlier)1.952026-07World Bank
Private consumption index (vs. same month a year earlier)3.692026-08Bank of Thailand (Bank of Thailand)
Unemployment rate (seasonally adjusted)1.022026-07World Bank

Culture

Religion (2020, Pew Research Center 2025「Religious Composition by Country, 2010-2020」): Buddhism 94.4%, Islam 4.5%, Christianity 1%, Hinduism 0%, No religion (no particular faith) 0%

Languages (2010, National Statistical Office of Thailand 2010 Census, table 7 (by region)): Thai only 90.7%, Thai and other languages 6.4%, Only languages other than Thai 2.9%, Malay (Jawi) 2.2%, Regional Thai languages 1.5%

Source

The figures on this page come from the following public statistics. On the 3D map, click a number to see, for each one, the URL of the original file, the location inside it, the text exactly as written, the date fetched, the file fingerprint (sha256), and for calculated numbers, the formula and inputs.

  • ILO (CC BY 4.0)
  • Pew Research Center 2025「Religious Composition by Country, 2010-2020」 (terms_attribution)
  • World Bank (CC BY 4.0)
  • Asian Development Bank KIDB (CC BY 3.0 IGO)
  • Bank of Thailand (Bank of Thailand)
  • Ministry of Commerce (Thailand) Trade Policy and Strategy Office (TPSO) (Public data on a government website. No terms of use stated (cite the source))
  • National Statistical Office of Thailand 2010 Census, table 7 (by region) (open_licence)
  • National Statistical Office of Thailand open data (Open Government License Thailand)
  • World Bank ICP (CC BY 4.0)
  • World Bank WDI (CC BY 4.0)
  • Tables from national statistics offices and ministries (24 newly fetched datasets) and tables already in the warehouse (e-Stat, OpenDOSM, National Statistical Office of Thailand, Brunei DEPS, Pakistan Bureau of Statistics, OCHA common datasets, OECD regional database, Pacific Community)
  • UN SDG (UN)
  • UN World Population Prospects 2024 (CC BY 3.0 IGO)
  • Calculated
Go to this country’s CSV

Myanmar MMR

National figures

IndicatorValueYearSource
Population55.18 million people2026UN World Population Prospects 2024
People aged 15–3417.51 million people2026UN World Population Prospects 2024
Median age30.41 years old2026UN World Population Prospects 2024
Share of people living in cities30.58 %2025World Bank WDI
Household consumption per 1 person (price-adjusted)2,271 International dollars2017World Bank ICP
GDP per 1 person (price-adjusted)6,012 International dollars2025World Bank WDI
Price level of everyday goods (world average =100)40.75 2017World Bank ICP
Inflation (1 year)27.4 %2023Asian Development Bank KIDB
Economic growth (1 year)-2.01 %2025World Bank WDI
Share of people using the internet58.54 %2023Asian Development Bank KIDB
Share of people with an account or mobile money47.79 %2021World Bank WDI
International visitors973,000 people2025Asian Development Bank KIDB
Income inequality (Gini coefficient)30.7 2017World Bank WDI
Unemployment rate3.05 %2025World Bank WDI

Figures by region and state (18 regions and states)

Sorted by population. “―” means there is no figure, or the figure is not published here because its terms of use are unclear.

regions and statesProsperity: share of people in the nation's richest 1/5
% (of people in the area) · 2016
Yangon Region46.9
Mandalay Region27.7
Mon21.9
Naypyidaw20.7
Kayin State18.5
Kachin State16.7
Kayah State15.7
Tanintharyi Region14.4
Sagaing District13.7
Magway Region12.3
Chin8
Ayeyarwady Region6.4
Rakhine State4.2
Bago District―
Bago (West)―
Shan (East)―
Shan (North)―
Shan State―

Culture

Religion (2024, UNdata UN Demographic Yearbook: population by religion (census)): Buddhism 91.3%, Christianity 4.6%, Islam 3.3%, Hinduism 0.6%, Animism 0.2%

Source

The figures on this page come from the following public statistics. On the 3D map, click a number to see, for each one, the URL of the original file, the location inside it, the text exactly as written, the date fetched, the file fingerprint (sha256), and for calculated numbers, the formula and inputs.

  • The DHS Program (USAID) STATcompiler API (Aggregate tables may be used with source credit (DHS terms of use))
  • UNdata UN Demographic Yearbook: population by religion (census) (terms_attribution)
  • Asian Development Bank KIDB (CC BY 3.0 IGO)
  • World Bank ICP (CC BY 4.0)
  • World Bank WDI (CC BY 4.0)
  • UN World Population Prospects 2024 (CC BY 3.0 IGO)
Go to this country’s CSV

Malaysia MYS

National figures

IndicatorValueYearSource
Population36.39 million people2026UN World Population Prospects 2024
People aged 15–3412.27 million people2026UN World Population Prospects 2024
Median age31.38 years old2026UN World Population Prospects 2024
Share of people living in cities77.39 %2025World Bank WDI
Household consumption per 1 person (price-adjusted)24,224 International dollars2025Calculated
GDP per 1 person (price-adjusted)41,498 International dollars2025World Bank WDI
Total household consumption (price-adjusted)871.51 billion International dollars2025World Bank WDI
Price level of everyday goods (world average =100)56.21 2021World Bank ICP
Inflation (1 year)1.38 %2025World Bank WDI
Economic growth (1 year)5.17 %2025World Bank WDI
Share of people using the internet98 %2024UN SDG
Share of people with an account or mobile money88.69 %2024World Bank WDI
International visitors26.61 million people2025Asian Development Bank KIDB
Income inequality (Gini coefficient)40.7 2021World Bank WDI
Unemployment rate3.76 %2025World Bank WDI

Figures by state (16 states)

Sorted by population. “―” means there is no figure, or the figure is not published here because its terms of use are unclear.

statesPopulation
people · 2026
Population per 1km² (population density)
people/km² · 2026
Share of people aged 0–14
% · 2026
Share of people aged 65+
% · 2026
Prosperity: median monthly household income
Ringgit/household per month (nominal) · 2024
Share of household spending on food and non-alcoholic beverages
% · 2024
Selangor7.45 million937.520.248.7210,72611.51
Johor4.22 million220.420.458.17,71216.45
Sabah3.77 million51.222.866.494,89022.71
Perak2.58 million121.919.7710.844,68719.4
Sarawak2.54 million20.519.19.675,50422.52
Kedah2.24 million235.723.249.734,89519.75
W.P. Kuala Lumpur2.08 million8,56916.587.4210,80211.94
Kelantan1.93 million128.027.087.794,08322.01
Penang1.81 million1,72418.068.857,38611.63
Pahang1.69 million46.922.617.494,97519.74
Terengganu1.26 million97.327.146.626,62721.43
Negeri Sembilan1.25 million187.522.328.635,59117.07
Malacca1.06 million617.621.527.576,89116.71
Perlis297,300363.019.178.814,95020.75
W.P. Putrajaya121,4002,47831.382.2210,7698.9
W.P. Labuan101,1001,09924.535.937,38316.86

Current economy (monthly)

IndicatorLatest valueMonthSource
Inflation (compared with the same month a year earlier)1.782026-07World Bank
Wholesale and retail sales volume (vs. same month a year earlier)5.092026-06Department of Statistics Malaysia (DOSM)

Culture

Religion (2020, Department of Statistics Malaysia, 2020 census, key findings, table 6): Islam 63.5%, Buddhism 18.7%, Christianity 9.1%, Hinduism 6.1%, Unknown 0.9%

Source

The figures on this page come from the following public statistics. On the 3D map, click a number to see, for each one, the URL of the original file, the location inside it, the text exactly as written, the date fetched, the file fingerprint (sha256), and for calculated numbers, the formula and inputs.

  • World Bank (CC BY 4.0)
  • Asian Development Bank KIDB (CC BY 3.0 IGO)
  • Department of Statistics Malaysia, 2020 census, key findings, table 6 (open_licence)
  • Department of Statistics Malaysia (DOSM) (CC BY 4.0)
  • World Bank ICP (CC BY 4.0)
  • World Bank WDI (CC BY 4.0)
  • Tables from national statistics offices and ministries (24 newly fetched datasets) and tables already in the warehouse (e-Stat, OpenDOSM, National Statistical Office of Thailand, Brunei DEPS, Pakistan Bureau of Statistics, OCHA common datasets, OECD regional database, Pacific Community)
  • UN SDG (UN)
  • UN World Population Prospects 2024 (CC BY 3.0 IGO)
  • Calculated
Go to this country’s CSV

Cambodia KHM

National figures

IndicatorValueYearSource
Population18.05 million people2026UN World Population Prospects 2024
People aged 15–345.80 million people2026UN World Population Prospects 2024
Median age26.37 years old2026UN World Population Prospects 2024
Share of people living in cities41.11 %2025World Bank WDI
Household consumption per 1 person (price-adjusted)4,560 International dollars2025Calculated
GDP per 1 person (price-adjusted)8,543 International dollars2025World Bank WDI
Total household consumption (price-adjusted)81.38 billion International dollars2025World Bank WDI
Price level of everyday goods (world average =100)55.59 2021World Bank ICP
Inflation (1 year)2.35 %2025World Bank WDI
Economic growth (1 year)5.35 %2025World Bank WDI
Share of people using the internet68.5 %2024UN SDG
Share of people with an account or mobile money39.03 %2024World Bank WDI
International visitors5.57 million people2025Asian Development Bank KIDB
Unemployment rate3.27 %2025ILO

Figures by state (25 states)

Sorted by population. “―” means there is no figure, or the figure is not published here because its terms of use are unclear.

statesPopulation
people · 2024
Population per 1km² (population density)
people/km² · 2024
Share of people aged 0–14
% · 2024
Share of people aged 65+
% · 2024
Prosperity: share of people in the nation's richest 1/5
% (of people in the area) · 2021
Share of household spending on food and non-alcoholic beverages
% · 2023
Phnom Penh2.54 million3,74620.465.9567.539.84
Kandal Province1.34 million421.325.077.8520.8―
Prey Veng Province1.18 million241.529.288.8410―
Siem Reap Province1.13 million109.829.675.1821.5―
Battambang Province1.11 million9528.97.214.1―
Takéo1.00 million281.925.578.4615.2―
Kampong Cham Province1.00 million220.527.469.337.3―
Kampong Speu Province978,188139.426.446.188.5―
Banteay Meanchey Province960,752143.826.846.114.1―
Tbong Khmum Province865,957164.928.827.637.5―
Kampong Thom Province759,7315529.697.057.3―
Kampot Province661,951135.826.377.6813.8―
Kampong Chhnang Province587,485106.428.717.19.7―
Svay Rieng Province585,780197.527.237.512.6―
Pursat Province468,12736.930.576.835.7―
Kratié Province417,74837.730.86.264―
Sihanoukville345,643178.420.863.7631.9―
Oddar Meanchey Province307,7035031.123.815.9―
Preah Vihear Province284,05920.630.914.24.8―
Ratanak Kiri242,40022.532.153.636.1―
Stung Treng Province184,72316.731.294.234.8―
Koh Kong Province140,34213.927.094.819.7―
Mondulkiri Province102,7937.232.452.7511.3―
Pailin Province83,727104.329.253.9721.8―
Kep47,558141.527.16.2526.2―

Current economy (monthly)

IndicatorLatest valueMonthSource
Inflation (compared with the same month a year earlier)5.532026-07World Bank

Culture

Religion (2020, Pew Research Center 2025「Religious Composition by Country, 2010-2020」): Buddhism 97.1%, Islam 2%, Other religions (Sikhism, Taoism, Shinto, Jainism, Bahá'í, folk religions, etc.) 0.5%, Christianity 0.3%, No religion (no particular faith) 0.1%

Languages (2019, UNdata UN Demographic Yearbook: population by language (census)): Khmer 95.7%, Cham 1.8%, Chinese 0.6%, Vietnamese 0.5%, (no name) 0.2%

Source

The figures on this page come from the following public statistics. On the 3D map, click a number to see, for each one, the URL of the original file, the location inside it, the text exactly as written, the date fetched, the file fingerprint (sha256), and for calculated numbers, the formula and inputs.

  • ILO (CC BY 4.0)
  • National Institute of Statistics, Cambodia Socio-Economic Survey 2023 Final Report, Table 2 (Consumption composition) (Public report of NIS (cite the source). The page has no terms-of-use statement)
  • Pew Research Center 2025「Religious Composition by Country, 2010-2020」 (terms_attribution)
  • The DHS Program (USAID) STATcompiler API (Aggregate tables may be used with source credit (DHS terms of use))
  • UN OCHA Humanitarian Data Exchange (Varies by dataset (mostly CC BY / CC BY-IGO). Check the dataset page before use.)
  • UNdata UN Demographic Yearbook: population by language (census) (terms_attribution)
  • World Bank (CC BY 4.0)
  • Asian Development Bank KIDB (CC BY 3.0 IGO)
  • World Bank ICP (CC BY 4.0)
  • World Bank WDI (CC BY 4.0)
  • Tables from national statistics offices and ministries (24 newly fetched datasets) and tables already in the warehouse (e-Stat, OpenDOSM, National Statistical Office of Thailand, Brunei DEPS, Pakistan Bureau of Statistics, OCHA common datasets, OECD regional database, Pacific Community)
  • UN SDG (UN)
  • UN World Population Prospects 2024 (CC BY 3.0 IGO)
  • Calculated
Go to this country’s CSV

Laos LAO

National figures

IndicatorValueYearSource
Population7.97 million people2026UN World Population Prospects 2024
People aged 15–342.82 million people2026UN World Population Prospects 2024
Median age25.28 years old2026UN World Population Prospects 2024
Share of people living in cities40.31 %2025World Bank WDI
Household consumption per 1 person (price-adjusted)3,634 International dollars2021World Bank ICP
GDP per 1 person (price-adjusted)10,383 International dollars2025World Bank WDI
Total household consumption (price-adjusted)26.46 billion International dollars2016World Bank WDI
Price level of everyday goods (world average =100)47.28 2021World Bank ICP
Inflation (1 year)7.74 %2025World Bank WDI
Economic growth (1 year)4.54 %2025World Bank WDI
Share of people using the internet65.6 %2024UN SDG
Share of people with an account or mobile money37.65 %2024World Bank WDI
International visitors3.94 million people2024Asian Development Bank KIDB
Income inequality (Gini coefficient)34.7 2024World Bank WDI
Unemployment rate1.19 %2025World Bank WDI

Figures by province (18 provinces)

Sorted by population. “―” means there is no figure, or the figure is not published here because its terms of use are unclear.

provincesPopulation
people · 2024
Population per 1km² (population density)
people/km² · 2024
Share of people aged 0–14
% · 2024
Share of people aged 65+
% · 2024
Savannakhet Province1.13 million5228.634.64
Vientiane Capital1.03 million262.324.865.33
Champasak Province789,77051.227.915.57
Vientiane Province484,18126.127.795.71
Luang Prabang479,83428.430.455.1
Salavan Province471,63744.133.734.36
Khammouane Province456,1782830.364.68
Sainyabūlī443,48027.128.285.86
Udomsai362,06223.632.464.22
Bolikhamsai Province335,18022.631.824.54
Hūaphan317,97319.333.734.63
Xiangkhouang Province275,89317.433.834.76
Bokeo Province216,03134.931.034.72
Lūang Namthā211,60722.731.614.7
Phongsaly Province198,32112.233.14.92
Attapeu Province171,59316.633.993.99
Sekong138,87118.135.933.51
Xaisomboun119,32526.536.952.96

Current economy (monthly)

IndicatorLatest valueMonthSource
Inflation (compared with the same month a year earlier)7.622026-07World Bank

Culture

Religion (2020, Pew Research Center 2025「Religious Composition by Country, 2010-2020」): Buddhism 64.2%, Other religions (Sikhism, Taoism, Shinto, Jainism, Bahá'í, folk religions, etc.) 34.2%, Christianity 1.5%, No religion (no particular faith) 0.1%, Islam 0%

Source

The figures on this page come from the following public statistics. On the 3D map, click a number to see, for each one, the URL of the original file, the location inside it, the text exactly as written, the date fetched, the file fingerprint (sha256), and for calculated numbers, the formula and inputs.

  • Pew Research Center 2025「Religious Composition by Country, 2010-2020」 (terms_attribution)
  • UN OCHA Humanitarian Data Exchange (Varies by dataset (mostly CC BY / CC BY-IGO). Check the dataset page before use.)
  • World Bank (CC BY 4.0)
  • Asian Development Bank KIDB (CC BY 3.0 IGO)
  • World Bank ICP (CC BY 4.0)
  • World Bank WDI (CC BY 4.0)
  • Tables from national statistics offices and ministries (24 newly fetched datasets) and tables already in the warehouse (e-Stat, OpenDOSM, National Statistical Office of Thailand, Brunei DEPS, Pakistan Bureau of Statistics, OCHA common datasets, OECD regional database, Pacific Community)
  • UN SDG (UN)
  • UN World Population Prospects 2024 (CC BY 3.0 IGO)
Go to this country’s CSV

Singapore SGP

National figures

IndicatorValueYearSource
Population5.91 million people2026UN World Population Prospects 2024
People aged 15–341.95 million people2026UN World Population Prospects 2024
Median age36.77 years old2026UN World Population Prospects 2024
Share of people living in cities100.0 %2025World Bank WDI
Household consumption per 1 person (price-adjusted)40,837 International dollars2025Calculated
GDP per 1 person (price-adjusted)163,354 International dollars2025World Bank WDI
Total household consumption (price-adjusted)239.75 billion International dollars2025World Bank WDI
Price level of everyday goods (world average =100)118.3 2021World Bank ICP
Inflation (1 year)0.9 %2025World Bank WDI
Economic growth (1 year)5.03 %2025World Bank WDI
Share of people using the internet94.4 %2024UN SDG
Share of people with an account or mobile money97.97 %2024World Bank WDI
International visitors12.43 million people2025Asian Development Bank KIDB
Unemployment rate3.25 %2025ILO

Figures by state/province (5 states/provinces)

Sorted by population. “―” means there is no figure, or the figure is not published here because its terms of use are unclear.

states/provincesPopulation
people · 2026
Population per 1km² (population density)
people/km² · 2026
Share of people aged 0–14
% · 2026
Share of people aged 65+
% · 2026
Prosperity: median monthly household income from work
Singapore dollars/household per month (nominal) · 2020
Central Region991,2707,26812.7222.318,897
North-East Region971,9307,14414.2718.589,410
West Region948,8003,65712.8618.829,112
East Region715,1806,30313.0120.929,633
North Region604,3404,33513.9815.798,281

Current economy (monthly)

IndicatorLatest valueMonthSource
Inflation (compared with the same month a year earlier)2.282026-07World Bank
Retail sales volume (year on year)2.972026-06World Bank
Unemployment rate (seasonally adjusted)22026-06World Bank

Culture

Religion (2020, Singapore Department of Statistics 2020 Census, table 17592): Buddhism 31.1%, No religion 20%, Islam 15.6%, Christianity (non-Catholic) 11.9%, Taoism 8.8%

Languages (2020, Singapore Department of Statistics 2020 Census, table 17596): English 48.3%, Chinese (Standard Mandarin) 29.9%, Malay 9.2%, Chinese dialects (Hokkien, Teochew, Cantonese, etc.) 8.7%, Tamil 2.5%

Source

The figures on this page come from the following public statistics. On the 3D map, click a number to see, for each one, the URL of the original file, the location inside it, the text exactly as written, the date fetched, the file fingerprint (sha256), and for calculated numbers, the formula and inputs.

  • ILO (CC BY 4.0)
  • Singapore Department of Statistics (SingStat) Table Builder (Singapore Open Data Licence (free to use with source credited))
  • World Bank (CC BY 4.0)
  • Asian Development Bank KIDB (CC BY 3.0 IGO)
  • Singapore Department of Statistics 2020 Census, table 17592 (open_licence)
  • Singapore Department of Statistics 2020 Census, table 17596 (open_licence)
  • World Bank ICP (CC BY 4.0)
  • World Bank WDI (CC BY 4.0)
  • Tables from national statistics offices and ministries (24 newly fetched datasets) and tables already in the warehouse (e-Stat, OpenDOSM, National Statistical Office of Thailand, Brunei DEPS, Pakistan Bureau of Statistics, OCHA common datasets, OECD regional database, Pacific Community)
  • UN SDG (UN)
  • UN World Population Prospects 2024 (CC BY 3.0 IGO)
  • Calculated
Go to this country’s CSV

Timor-Leste TLS

National figures

IndicatorValueYearSource
Population1.44 million people2026UN World Population Prospects 2024
People aged 15–34543,488 people2026UN World Population Prospects 2024
Median age22.09 years old2026UN World Population Prospects 2024
Share of people living in cities28.79 %2025World Bank WDI
Household consumption per 1 person (price-adjusted)2,444 International dollars2024Calculated
GDP per 1 person (price-adjusted)4,809 International dollars2025World Bank WDI
Total household consumption (price-adjusted)3.42 billion International dollars2024World Bank WDI
Inflation (1 year)0.43 %2025World Bank WDI
Economic growth (1 year)6.98 %2025World Bank WDI
Share of people using the internet35 %2021UN SDG
International visitors97,000 people2024Asian Development Bank KIDB
Income inequality (Gini coefficient)28.7 2014World Bank WDI
Unemployment rate1.59 %2025World Bank WDI

Figures by state/province (13 states/provinces)

Sorted by population. “―” means there is no figure, or the figure is not published here because its terms of use are unclear.

states/provincesPopulation
people · 2022
Population per 1km² (population density)
people/km² · 2022
Share of people aged 0–14
% · 2022
Share of people aged 65+
% · 2022
Prosperity: share of people in the nation's richest 1/5
% (of people in the area) · 2016
Dili Municipality364,423994.133.272.6959.8
Ermera Municipality141,538184.438.754.934.1
Baucau Municipality127,21984.734.598.0812.6
Bobonaro Municipality99,88472.635.627.2110
Liquiçá Municipality82,551150.537.746.0311.9
Viqueque Municipality79,41242.436.918.528.3
Oe-Cusse Ambeno72,32888.933.477.588.2
Covalima70,8695935.496.7911.1
Lautém Municipality66,96637.137.167.1312.2
Ainaro Municipality65,69281.838.136.53.7
Manufahi Municipality58,33644.234.557.5311.3
Aileu municipality57,30877.837.475.435.9
Manatuto Municipality49,68927.934.767.4814.9

Culture

Religion (2022, UNdata UN Demographic Yearbook: population by religion (census)): Catholic 90.7%, Other 7.1%, Christian: Protestant Evangelical 1.9%, Islam 0.2%, Buddhism 0%

Languages (2022, UNdata UN Demographic Yearbook: population by language (census)): Tetum (Tetun Prasa, the common language of Dili) 66.9%, Mambai 13.8%, Makasae 10%, Tetum (Tetun Terik) 7.5%, Baikenu (Dawan) 6.2%

Source

The figures on this page come from the following public statistics. On the 3D map, click a number to see, for each one, the URL of the original file, the location inside it, the text exactly as written, the date fetched, the file fingerprint (sha256), and for calculated numbers, the formula and inputs.

  • The DHS Program (USAID) STATcompiler API (Aggregate tables may be used with source credit (DHS terms of use))
  • UN OCHA Humanitarian Data Exchange (Varies by dataset (mostly CC BY / CC BY-IGO). Check the dataset page before use.)
  • UNdata UN Demographic Yearbook: population by religion (census) (terms_attribution)
  • UNdata UN Demographic Yearbook: population by language (census) (terms_attribution)
  • Asian Development Bank KIDB (CC BY 3.0 IGO)
  • World Bank WDI (CC BY 4.0)
  • Tables from national statistics offices and ministries (24 newly fetched datasets) and tables already in the warehouse (e-Stat, OpenDOSM, National Statistical Office of Thailand, Brunei DEPS, Pakistan Bureau of Statistics, OCHA common datasets, OECD regional database, Pacific Community)
  • UN SDG (UN)
  • UN World Population Prospects 2024 (CC BY 3.0 IGO)
  • Calculated
Go to this country’s CSV

Brunei BRN

National figures

IndicatorValueYearSource
Population469,775 people2026UN World Population Prospects 2024
People aged 15–34145,864 people2026UN World Population Prospects 2024
Median age33.18 years old2026UN World Population Prospects 2024
Share of people living in cities75.01 %2025World Bank WDI
Household consumption per 1 person (price-adjusted)23,443 International dollars2025Calculated
GDP per 1 person (price-adjusted)92,430 International dollars2025World Bank WDI
Total household consumption (price-adjusted)10.93 billion International dollars2025World Bank WDI
Price level of everyday goods (world average =100)65.01 2021World Bank ICP
Inflation (1 year)-0.3 %2025World Bank WDI
Economic growth (1 year)0.67 %2025World Bank WDI
Share of people using the internet96.3 %2024UN SDG
International visitors287,000 people2025Asian Development Bank KIDB
Unemployment rate5.35 %2025ILO

Figures by state/province (4 states/provinces)

Sorted by population. “―” means there is no figure, or the figure is not published here because its terms of use are unclear.

states/provincesPopulation
people · 2025
Population per 1km² (population density)
people/km² · 2025
Brunei-Muara District332,700582.7
Belait District67,90024.9
Tutong District48,50041.6
Temburong District9,5007.3

Culture

Religion (2021, UNdata UN Demographic Yearbook: population by religion (census)): Islam 82.1%, Christianity 6.7%, Buddhism 6.3%, Other religions 4.9%

Source

The figures on this page come from the following public statistics. On the 3D map, click a number to see, for each one, the URL of the original file, the location inside it, the text exactly as written, the date fetched, the file fingerprint (sha256), and for calculated numbers, the formula and inputs.

  • Department of Economic Planning and Statistics (DEPS), Brunei — Population Estimates 2025 (DEPS Brunei (free to use with source credited))
  • ILO (CC BY 4.0)
  • UNdata UN Demographic Yearbook: population by religion (census) (terms_attribution)
  • Asian Development Bank KIDB (CC BY 3.0 IGO)
  • World Bank ICP (CC BY 4.0)
  • World Bank WDI (CC BY 4.0)
  • UN SDG (UN)
  • UN World Population Prospects 2024 (CC BY 3.0 IGO)
  • Calculated
Go to this country’s CSV

South Asia

India IND

National figures

IndicatorValueYearSource
Population1.48 billion people2026UN World Population Prospects 2024
People aged 15–34502.58 million people2026UN World Population Prospects 2024
Median age29.22 years old2026UN World Population Prospects 2024
Share of people living in cities35.69 %2025World Bank WDI
Household consumption per 1 person (price-adjusted)6,741 International dollars2025Calculated
GDP per 1 person (price-adjusted)11,748 International dollars2025World Bank WDI
Total household consumption (price-adjusted)9.87 trillion International dollars2025World Bank WDI
Price level of everyday goods (world average =100)40.44 2021World Bank ICP
Inflation (1 year)2.4 %2025World Bank WDI
Economic growth (1 year)7.57 %2025World Bank WDI
Share of people using the internet70 %2025UN SDG
Share of people with an account or mobile money89.02 %2024World Bank WDI
International visitors9.82 million people2024Asian Development Bank KIDB
Income inequality (Gini coefficient)25.5 2022World Bank WDI
Unemployment rate4.51 %2025ILO

Figures by state (36 states and union territories)

Sorted by population. “―” means there is no figure, or the figure is not published here because its terms of use are unclear.

states and union territoriesProsperity: net state domestic product per 1 person
Rupees/person per year (nominal) · 2024
Share of household spending on food and non-alcoholic beverages
% · 2023-24
Sikkim585,2944.8
Goa542,3413.78
Delhi457,7083.98
Chandigarh452,9933.32
Karnataka381,7493.2
Telangana346,1653.2
Haryana319,3634.57
Tamil Nadu313,3293.67
Gujarat299,8604.76
Maharashtra285,2903.6
Kerala281,2693.02
Andaman and Nicobar Islands275,6476.53
Puducherry252,1633.38
Ladakh242,3595.31
Andhra Pradesh239,3113.88
Mizoram234,9966.02
Himachal Pradesh234,4354.01
Uttarakhand232,4573.98
Arunachal Pradesh212,3625.19
Punjab201,0614.09
Tripura169,4185.89
Rajasthan167,0263.81
Odisha155,1255.77
Nagaland154,8285.12
West Bengal150,2215.6
Chhattisgarh149,7816.95
Assam143,8525.24
Madhya Pradesh141,7564.41
Meghalaya141,1945.58
Jammu and Kashmir139,4674.56
Manipur119,9675.32
Jharkhand106,5285.16
Uttar Pradesh98,0474.51
Bihar62,2035.6
Lakshadweep―4.13
Dadra and Nagar Haveli and Daman and Diu―6.58

Current economy (monthly)

IndicatorLatest valueMonthSource
Business confidence (OECD, 100=long-term average)95.432026-02OECD
Consumer confidence (OECD, 100= long-term average)101.32026-06OECD
Inflation (compared with the same month a year earlier)4.432026-07World Bank
Unemployment rate (seasonally adjusted)62021-12World Bank

Culture

Religion (2020, Pew Research Center 2025「Religious Composition by Country, 2010-2020」): Hinduism 79.4%, Islam 15.2%, Other religions (Sikhism, Taoism, Shinto, Jainism, Bahá'í, folk religions, etc.) 2.5%, Christianity 2.2%, Buddhism 0.7%

Languages (2001, UNdata UN Demographic Yearbook: population by language (census)): Hindi 41%, Bengali 8.1%, Telugu 7.2%, Marathi 7%, Tamil 5.9%

Source

The figures on this page come from the following public statistics. On the 3D map, click a number to see, for each one, the URL of the original file, the location inside it, the text exactly as written, the date fetched, the file fingerprint (sha256), and for calculated numbers, the formula and inputs.

  • ILO (CC BY 4.0)
  • Ministry of Statistics and Programme Implementation (MoSPI), Government of India (Government Open Data License - India (commercial use allowed with source credited))
  • OECD (OECD Terms)
  • Pew Research Center 2025「Religious Composition by Country, 2010-2020」 (terms_attribution)
  • UNdata UN Demographic Yearbook: population by language (census) (terms_attribution)
  • World Bank (CC BY 4.0)
  • Asian Development Bank KIDB (CC BY 3.0 IGO)
  • World Bank ICP (CC BY 4.0)
  • World Bank WDI (CC BY 4.0)
  • UN SDG (UN)
  • UN World Population Prospects 2024 (CC BY 3.0 IGO)
  • Calculated
Go to this country’s CSV

Pakistan PAK

National figures

IndicatorValueYearSource
Population259.30 million people2026UN World Population Prospects 2024
People aged 15–3491.40 million people2026UN World Population Prospects 2024
Median age20.77 years old2026UN World Population Prospects 2024
Share of people living in cities39.53 %2025World Bank WDI
Household consumption per 1 person (price-adjusted)5,702 International dollars2025Calculated
GDP per 1 person (price-adjusted)6,573 International dollars2025World Bank WDI
Total household consumption (price-adjusted)1.46 trillion International dollars2025World Bank WDI
Price level of everyday goods (world average =100)39.2 2021World Bank ICP
Inflation (1 year)3.55 %2025World Bank WDI
Economic growth (1 year)3.7 %2025World Bank WDI
Share of people using the internet57.3 %2024UN SDG
Share of people with an account or mobile money27.3 %2024World Bank WDI
International visitors2.21 million people2023Asian Development Bank KIDB
Income inequality (Gini coefficient)33.5 2024World Bank WDI
Unemployment rate6.96 %2025ILO

Figures by state (7 states)

Sorted by population. “―” means there is no figure, or the figure is not published here because its terms of use are unclear.

statesShare of people aged 0–14
% · 2023
Share of people aged 65+
% · 2023
Prosperity: share of people in the nation's richest 1/5
% (of people in the area) · 2017
Share of household spending on food and non-alcoholic beverages
% · 2024-25
Balochistan49.662.116.541.38
Khyber Pakhtunkhwa43.453.2612.3140.49
Sindh41.783.0617.933.56
Punjab38.21424.536.68
Islamabad32.284.3157.2―
Azad Kashmir――14.3―
Gilgit-Baltistan――3.3―

Current economy (monthly)

IndicatorLatest valueMonthSource
Inflation (compared with the same month a year earlier)9.242026-07World Bank
Unemployment rate (seasonally adjusted)6.92025-12World Bank

Culture

Religion (2023, Pakistan Bureau of Statistics, 2023 census, table 9): Islam 96.4%, Hinduism (jati) 1.6%, Christianity 1.4%, Scheduled Castes (Hindu) 0.6%, Ahmadiyya 0.1%

Languages (2023, Pakistan Bureau of Statistics, 2023 census, table 11): Punjabi 37%, Pashto 18.1%, Sindhi 14.3%, Saraiki 12%, Urdu 9.3%

Source

The figures on this page come from the following public statistics. On the 3D map, click a number to see, for each one, the URL of the original file, the location inside it, the text exactly as written, the date fetched, the file fingerprint (sha256), and for calculated numbers, the formula and inputs.

  • ILO (CC BY 4.0)
  • Pakistan Bureau of Statistics, Household Integrated Economic Survey (HIES) 2024-25, Table 16 (amounts) / Table 15 (shares)
  • The DHS Program (USAID) STATcompiler API (Aggregate tables may be used with source credit (DHS terms of use))
  • World Bank (CC BY 4.0)
  • Asian Development Bank KIDB (CC BY 3.0 IGO)
  • Pakistan Bureau of Statistics, 2023 census, table 11 (open_licence)
  • Pakistan Bureau of Statistics, 2023 census, table 9 (open_licence)
  • World Bank ICP (CC BY 4.0)
  • World Bank WDI (CC BY 4.0)
  • Tables from national statistics offices and ministries (24 newly fetched datasets) and tables already in the warehouse (e-Stat, OpenDOSM, National Statistical Office of Thailand, Brunei DEPS, Pakistan Bureau of Statistics, OCHA common datasets, OECD regional database, Pacific Community)
  • UN SDG (UN)
  • UN World Population Prospects 2024 (CC BY 3.0 IGO)
  • Calculated
Go to this country’s CSV

Bangladesh BGD

National figures

IndicatorValueYearSource
Population177.82 million people2026UN World Population Prospects 2024
People aged 15–3462.50 million people2026UN World Population Prospects 2024
Median age26.3 years old2026UN World Population Prospects 2024
Share of people living in cities33.24 %2025World Bank WDI
Household consumption per 1 person (price-adjusted)6,488 International dollars2025Calculated
GDP per 1 person (price-adjusted)10,154 International dollars2025World Bank WDI
Total household consumption (price-adjusted)1.14 trillion International dollars2025World Bank WDI
Price level of everyday goods (world average =100)50.17 2021World Bank ICP
Inflation (1 year)8.77 %2025World Bank WDI
Economic growth (1 year)3.49 %2025World Bank WDI
Share of people using the internet53.4 %2024UN SDG
Share of people with an account or mobile money43.28 %2024World Bank WDI
International visitors135,000 people2021Asian Development Bank KIDB
Income inequality (Gini coefficient)30.9 2022World Bank WDI
Unemployment rate3.78 %2025World Bank WDI

Figures by division (8 divisions)

Sorted by population. “―” means there is no figure, or the figure is not published here because its terms of use are unclear.

divisionsPopulation
people · 2022
Population per 1km² (population density)
people/km² · 2022
Share of people aged 0–14
% · 2022
Share of people aged 65+
% · 2022
Prosperity: share of people in the nation's richest 1/5
% (of people in the area) · 2022
Dhaka District47.31 million2,30723.236.1233.8
Chattogram Division32.59 million961.228.947.2418.4
Rajshahi Division20.15 million1,11023.487.6914.3
Rangpur Division17.36 million1,07325.797.578.5
Khulna Division16.13 million723.922.638.6123.9
Sylhet Division12.18 million963.730.577.0417.6
Mymensingh District11.81 million1,10728.58.498.7
Barishal District8.11 million613.326.918.9512.7

Current economy (monthly)

IndicatorLatest valueMonthSource
Inflation (compared with the same month a year earlier)8.282026-07World Bank

Culture

Religion (2022, UNdata UN Demographic Yearbook: population by religion (census)): Islam 91.1%, Hinduism 8%, Buddhism 0.6%, Christianity 0.3%, Other 0.1%

Source

The figures on this page come from the following public statistics. On the 3D map, click a number to see, for each one, the URL of the original file, the location inside it, the text exactly as written, the date fetched, the file fingerprint (sha256), and for calculated numbers, the formula and inputs.

  • The DHS Program (USAID) STATcompiler API (Aggregate tables may be used with source credit (DHS terms of use))
  • UN OCHA Humanitarian Data Exchange (Varies by dataset (mostly CC BY / CC BY-IGO). Check the dataset page before use.)
  • UNdata UN Demographic Yearbook: population by religion (census) (terms_attribution)
  • World Bank (CC BY 4.0)
  • Asian Development Bank KIDB (CC BY 3.0 IGO)
  • World Bank ICP (CC BY 4.0)
  • World Bank WDI (CC BY 4.0)
  • Tables from national statistics offices and ministries (24 newly fetched datasets) and tables already in the warehouse (e-Stat, OpenDOSM, National Statistical Office of Thailand, Brunei DEPS, Pakistan Bureau of Statistics, OCHA common datasets, OECD regional database, Pacific Community)
  • UN SDG (UN)
  • UN World Population Prospects 2024 (CC BY 3.0 IGO)
  • Calculated
Go to this country’s CSV

Afghanistan AFG

National figures

FigureValueUnitYearSource
Population45.0 millionpeople2026UN World Population Prospects 2024
Population growth2.7%/year2026UN World Population Prospects 2024
Median age17.4years2026UN World Population Prospects 2024
Share aged 0–1442.2%2026UN World Population Prospects 2024
Share aged 15–6455.3%2026UN World Population Prospects 2024
Share aged 65+2.5%2026UN World Population Prospects 2024
People aged 15–3416.4 millionpeople2026UN World Population Prospects 2024
Fertility rate4.6people2026UN World Population Prospects 2024
Life expectancy66.8years2026UN World Population Prospects 2024
Urban population share25.9%2025World Bank World Development Indicators
Population density69.4people/km²2026UN World Population Prospects 2024
Average household size7.8people2010UN Household Size and Composition
Household consumption19.9 billionUSD2024World Bank World Development Indicators
Household consumption (local currency)1.4 trillionlocal currency2025Asian Development Bank Key Indicators
Household consumption (PPP)100.8 billioninternational $2024World Bank World Development Indicators
Household consumption per person466USD/person2024Calculated (household consumption ÷ population)
Household consumption per person (PPP)2,363international $/person2024Calculated (household consumption ÷ population)
Household consumption growth14.9%/year2025Asian Development Bank Key Indicators
Household consumption share of GDP110%2025Asian Development Bank Key Indicators
Inflation (CPI)-4.2%/year2025Asian Development Bank Key Indicators
Exchange rate (local currency per USD)76.8local currency/USD2020World Bank World Development Indicators
GDP17.8 billionUSD2024World Bank World Development Indicators
GDP per person498USD/person2025Asian Development Bank Key Indicators
GDP per person (PPP)2,236international $/person2024World Bank World Development Indicators
Economic growth1.9%/year2025Asian Development Bank Key Indicators
Services share of the economy48.1%2025Asian Development Bank Key Indicators
New business density0.22per 1,000 people2018World Bank World Development Indicators
Unemployment rate13.4%2025World Bank World Development Indicators
Youth unemployment rate16.8%2025World Bank World Development Indicators
Labour force participation rate37.5%2025World Bank World Development Indicators
Female labour force participation rate5.1%2025World Bank World Development Indicators
Employment in services29.5%2025World Bank World Development Indicators
Wage and salaried workers16.6%2025World Bank World Development Indicators
Informal employment86.1%2021ILO ILOSTAT
Gross national income per person390USD/person2024World Bank World Development Indicators
Internet users16.1%2024UN SDG Indicators
Number of internet users6.9 millionpeople2024Calculated (household consumption ÷ population)
Mobile phone ownership48.4%2024UN SDG Indicators
Mobile subscriptions per 100 people60.1per 100 people2024World Bank World Development Indicators
Fixed broadband per 100 people0.08per 100 people2023World Bank World Development Indicators
Population covered by 4G37.3%2024UN SDG Indicators
Account ownership (bank or mobile money)9.7%2021World Bank World Development Indicators
Tertiary enrolment10.9%2020World Bank World Development Indicators
Go to downloads

Nepal NPL

National figures

IndicatorValueYearSource
Population29.63 million people2026UN World Population Prospects 2024
People aged 15–3410.66 million people2026UN World Population Prospects 2024
Median age25.7 years old2026UN World Population Prospects 2024
Share of people living in cities67 %2025World Bank WDI
Household consumption per 1 person (price-adjusted)5,028 International dollars2025Calculated
GDP per 1 person (price-adjusted)6,175 International dollars2025World Bank WDI
Total household consumption (price-adjusted)148.93 billion International dollars2025World Bank WDI
Price level of everyday goods (world average =100)41.89 2021World Bank ICP
Inflation (1 year)2.65 %2025World Bank WDI
Economic growth (1 year)4.43 %2025World Bank WDI
Share of people using the internet46.3 %2024UN SDG
Share of people with an account or mobile money59.99 %2024World Bank WDI
International visitors1.16 million people2025Asian Development Bank KIDB
Income inequality (Gini coefficient)30 2022World Bank WDI
Unemployment rate10.46 %2025World Bank WDI

Figures by state (7 states)

Sorted by population. “―” means there is no figure, or the figure is not published here because its terms of use are unclear.

statesProsperity: gross regional product per 1 person
Nepalese rupees/person per year (nominal) · 2024
Share of household spending on food and non-alcoholic beverages
% · 2022-23
Bagmati Province332,43946.1
Gandaki Province208,34654.6
Koshi Province178,82252.4
Lumbini Province155,05449.3
Sudurpaschim148,63451.7
Karnali Province142,68656.5
Madhesh Province119,35757.2

Current economy (monthly)

IndicatorLatest valueMonthSource
Inflation (compared with the same month a year earlier)4.542020-09World Bank

Source

The figures on this page come from the following public statistics. On the 3D map, click a number to see, for each one, the URL of the original file, the location inside it, the text exactly as written, the date fetched, the file fingerprint (sha256), and for calculated numbers, the formula and inputs.

  • National Statistics Office, Nepal Living Standards Survey IV 2022/23 Statistical Report (6/2024) Table 11.2
  • National Statistics Office, Nepal (Provincial GDP 2080/81) (NSO Nepal (free to use with source credited))
  • World Bank (CC BY 4.0)
  • Asian Development Bank KIDB (CC BY 3.0 IGO)
  • World Bank ICP (CC BY 4.0)
  • World Bank WDI (CC BY 4.0)
  • UN SDG (UN)
  • UN World Population Prospects 2024 (CC BY 3.0 IGO)
  • Calculated
Go to this country’s CSV

Sri Lanka LKA

National figures

IndicatorValueYearSource
Population23.35 million people2026UN World Population Prospects 2024
People aged 15–346.80 million people2026UN World Population Prospects 2024
Median age33.62 years old2026UN World Population Prospects 2024
Share of people living in cities20.45 %2025World Bank WDI
Household consumption per 1 person (price-adjusted)11,727 International dollars2025Calculated
GDP per 1 person (price-adjusted)17,065 International dollars2025World Bank WDI
Total household consumption (price-adjusted)272.42 billion International dollars2025World Bank WDI
Price level of everyday goods (world average =100)41.51 2021World Bank ICP
Inflation (1 year)-4.76 %2025World Bank WDI
Economic growth (1 year)4.95 %2025World Bank WDI
Share of people using the internet54.6 %2024UN SDG
Share of people with an account or mobile money81.69 %2024World Bank WDI
International visitors2.36 million people2025Asian Development Bank KIDB
Income inequality (Gini coefficient)37.7 2019World Bank WDI
Unemployment rate4 %2025World Bank WDI

Figures by state/province (9 states/provinces)

Sorted by population. “―” means there is no figure, or the figure is not published here because its terms of use are unclear.

states/provincesProsperity: median monthly household income
Sri Lankan rupees/household per month (nominal) · 2019
Western75,000
North Western55,614
Southern50,270
Central49,475
North Central47,415
Sabaragamuwa Province45,797
Northern42,491
Uva40,055
Eastern38,871

Current economy (monthly)

IndicatorLatest valueMonthSource
Business conditions (national survey, 50 = neutral)61.362026-07Central Bank of Sri Lanka (CBSL)
Unemployment rate (seasonally adjusted)3.92025-12World Bank

Culture

Languages (2001, UNdata UN Demographic Yearbook: population by language (census)): English 92.9%, Sinhala 20.3%, Tamil 14.4%

Source

The figures on this page come from the following public statistics. On the 3D map, click a number to see, for each one, the URL of the original file, the location inside it, the text exactly as written, the date fetched, the file fingerprint (sha256), and for calculated numbers, the formula and inputs.

  • Central Bank of Sri Lanka (CBSL) (CBSL (credit the source))
  • Department of Census and Statistics, Sri Lanka (HIES 2019 Final Results) (DCS Sri Lanka (free to use with source credited))
  • UNdata UN Demographic Yearbook: population by language (census) (terms_attribution)
  • World Bank (CC BY 4.0)
  • Asian Development Bank KIDB (CC BY 3.0 IGO)
  • World Bank ICP (CC BY 4.0)
  • World Bank WDI (CC BY 4.0)
  • UN SDG (UN)
  • UN World Population Prospects 2024 (CC BY 3.0 IGO)
  • Calculated
Go to this country’s CSV

Bhutan BTN

National figures

IndicatorValueYearSource
Population802,214 people2026UN World Population Prospects 2024
People aged 15–34290,995 people2026UN World Population Prospects 2024
Median age30.99 years old2026UN World Population Prospects 2024
Share of people living in cities43.43 %2025World Bank WDI
Household consumption per 1 person (price-adjusted)9,116 International dollars2024Calculated
GDP per 1 person (price-adjusted)19,594 International dollars2025World Bank WDI
Total household consumption (price-adjusted)7.22 billion International dollars2024World Bank WDI
Price level of everyday goods (world average =100)40.04 2021World Bank ICP
Inflation (1 year)3.56 %2025World Bank WDI
Economic growth (1 year)8.01 %2025World Bank WDI
Share of people using the internet91.3 %2024UN SDG
Share of people with an account or mobile money33.67 %2014World Bank WDI
International visitors189,000 people2025Asian Development Bank KIDB
Income inequality (Gini coefficient)28.5 2022World Bank WDI
Unemployment rate3.36 %2025ILO

Figures by state/province (20 states/provinces)

Sorted by population. “―” means there is no figure, or the figure is not published here because its terms of use are unclear.

states/provincesPopulation
people · 2024
Population per 1km² (population density)
people/km² · 2024
Share of people aged 0–14
% · 2024
Share of people aged 65+
% · 2024
Prosperity: average annual household income
Ngultrum/household per year (nominal) · 2022
Thimphu District166,83393.821.244.6731,292
Chukha District70,20537.721.865.08325,650
Samtse District63,2454923.37.61194,777
Paro52,90541.521.867.08456,874
Sarpang District50,96931.121.296.74277,702
Wangduephodrang47,8941222.26.71417,048
Trashigang District41,72319.124.178.84421,946
Monggar36,06018.726.768.43222,109
Samdrupjongkhar34,84518.724.457.42290,062
Punakha District31,67628.822.587.58431,930
Dagana District26,06715.324.47.91306,849
Tsirang District24,37338.622.599.24276,763
Pemagatshel District23,87623.623.811.49241,646
Trongsa District23,4301318.366.5391,723
Bumthang District18,4996.924.368.23328,041
Zhemgang District16,5736.925.1410.41177,945
Yangtse16,44211.528.198.48262,405
Haa13,8847.423.036.74284,767
Lhuntse District13,2904.725.679.51215,448
Gasa District4,4351.424.156.94676,218

Culture

Religion (2020, Pew Research Center 2025「Religious Composition by Country, 2010-2020」): Buddhism 74.7%, Hinduism 22.5%, Other religions (Sikhism, Taoism, Shinto, Jainism, Bahá'í, folk religions, etc.) 1.9%, Christianity 0.6%, Islam 0.2%

Source

The figures on this page come from the following public statistics. On the 3D map, click a number to see, for each one, the URL of the original file, the location inside it, the text exactly as written, the date fetched, the file fingerprint (sha256), and for calculated numbers, the formula and inputs.

  • ILO (CC BY 4.0)
  • National Statistics Bureau of Bhutan, Bhutan Living Standards Survey 2022 Report (Table 7.21) (NSB Bhutan (free to use with source credited))
  • Pew Research Center 2025「Religious Composition by Country, 2010-2020」 (terms_attribution)
  • UN OCHA Humanitarian Data Exchange (Varies by dataset (mostly CC BY / CC BY-IGO). Check the dataset page before use.)
  • Asian Development Bank KIDB (CC BY 3.0 IGO)
  • World Bank ICP (CC BY 4.0)
  • World Bank WDI (CC BY 4.0)
  • Tables from national statistics offices and ministries (24 newly fetched datasets) and tables already in the warehouse (e-Stat, OpenDOSM, National Statistical Office of Thailand, Brunei DEPS, Pakistan Bureau of Statistics, OCHA common datasets, OECD regional database, Pacific Community)
  • UN SDG (UN)
  • UN World Population Prospects 2024 (CC BY 3.0 IGO)
  • Calculated
Go to this country’s CSV

Maldives MDV

National figures

IndicatorValueYearSource
Population531,517 people2026UN World Population Prospects 2024
People aged 15–34175,826 people2026UN World Population Prospects 2024
Median age33.43 years old2026UN World Population Prospects 2024
Share of people living in cities42.51 %2025World Bank WDI
Household consumption per 1 person (price-adjusted)11,279 International dollars2024Calculated
GDP per 1 person (price-adjusted)28,555 International dollars2025World Bank WDI
Total household consumption (price-adjusted)5.95 billion International dollars2024World Bank WDI
Price level of everyday goods (world average =100)92.9 2021World Bank ICP
Inflation (1 year)4.01 %2025World Bank WDI
Economic growth (1 year)6.31 %2025World Bank WDI
Share of people using the internet85.2 %2024UN SDG
Share of people with an account or mobile money79.55 %2017World Bank WDI
International visitors2.25 million people2025Asian Development Bank KIDB
Income inequality (Gini coefficient)29.3 2019World Bank WDI
Unemployment rate4.51 %2025World Bank WDI

Figures by state/province (5 states/provinces)

Sorted by population. “―” means there is no figure, or the figure is not published here because its terms of use are unclear.

states/provincesPopulation
people · 2026
Share of people aged 0–14
% · 2026
Share of people aged 65+
% · 2026
Male Economic254,55714.693.33
South Central136,272144.02
North Central76,79216.685.29
South65,15218.767.81
North57,30723.567.12

Current economy (monthly)

IndicatorLatest valueMonthSource
Inflation (compared with the same month a year earlier)-1.342020-12World Bank

Culture

Religion (2020, Pew Research Center 2025「Religious Composition by Country, 2010-2020」): Islam 94.1%, Hinduism 2.5%, Christianity 1.6%, Buddhism 1.3%, Other religions (Sikhism, Taoism, Shinto, Jainism, Bahá'í, folk religions, etc.) 0.3%

Source

The figures on this page come from the following public statistics. On the 3D map, click a number to see, for each one, the URL of the original file, the location inside it, the text exactly as written, the date fetched, the file fingerprint (sha256), and for calculated numbers, the formula and inputs.

  • Maldives Bureau of Statistics, Population Projection 2022–2062 Tables (Revised, 23 March 2026) (The projection report states that it “may be freely viewed, quoted, reproduced and translated if the source is cited” (Population Projection 2022-2026 report))
  • Pew Research Center 2025「Religious Composition by Country, 2010-2020」 (terms_attribution)
  • World Bank (CC BY 4.0)
  • Asian Development Bank KIDB (CC BY 3.0 IGO)
  • World Bank ICP (CC BY 4.0)
  • World Bank WDI (CC BY 4.0)
  • Tables from national statistics offices and ministries (24 newly fetched datasets) and tables already in the warehouse (e-Stat, OpenDOSM, National Statistical Office of Thailand, Brunei DEPS, Pakistan Bureau of Statistics, OCHA common datasets, OECD regional database, Pacific Community)
  • UN SDG (UN)
  • UN World Population Prospects 2024 (CC BY 3.0 IGO)
  • Calculated
Go to this country’s CSV

Central Asia

Uzbekistan UZB

National figures

FigureValueUnitYearSource
Population37.7 millionpeople2026UN World Population Prospects 2024
Population growth1.8%/year2026UN World Population Prospects 2024
Median age27.0years2026UN World Population Prospects 2024
Share aged 0–1431.5%2026UN World Population Prospects 2024
Share aged 15–6462.3%2026UN World Population Prospects 2024
Share aged 65+6.3%2026UN World Population Prospects 2024
People aged 15–3411.1 millionpeople2026UN World Population Prospects 2024
Fertility rate3.4people2026UN World Population Prospects 2024
Life expectancy72.8years2026UN World Population Prospects 2024
Urban population share51.0%2025World Bank World Development Indicators
Population density88.7people/km²2026UN World Population Prospects 2024
Average household size5.2people2006UN Household Size and Composition
Household consumption94.3 billionUSD2025World Bank World Development Indicators
Household consumption (local currency)1,186.4 trillionlocal currency2025World Bank World Development Indicators
Household consumption (PPP)332.0 billioninternational $2025World Bank World Development Indicators
Household consumption per person2,545USD/person2025Calculated (household consumption ÷ population)
Household consumption per person (PPP)8,961international $/person2025Calculated (household consumption ÷ population)
Actual individual consumption per person (PPP)5,956international $/person2021World Bank International Comparison Program
Price level36.3index (world = 100)2021World Bank International Comparison Program
Food price level73.2index (world = 100)2021World Bank International Comparison Program
Household consumption growth9.5%/year2025World Bank World Development Indicators
Household consumption share of GDP64.1%2025World Bank World Development Indicators
Inflation (CPI)8.8%/year2025World Bank World Development Indicators
Exchange rate (local currency per USD)12,579local currency/USD2025World Bank World Development Indicators
GDP147.0 billionUSD2025World Bank World Development Indicators
GDP per person3,968USD/person2025World Bank World Development Indicators
GDP per person (PPP)13,601international $/person2025World Bank World Development Indicators
Economic growth7.7%/year2025World Bank World Development Indicators
Services share of the economy46.5%2025World Bank World Development Indicators
New business density2.8per 1,000 people2024World Bank World Development Indicators
International tourist arrivals11.7 millionpeople2025Asian Development Bank Key Indicators
Outbound departures8.4 millionpeople2019World Bank World Development Indicators
Unemployment rate4.6%2025World Bank World Development Indicators
Youth unemployment rate11.4%2025World Bank World Development Indicators
Labour force participation rate57.5%2025World Bank World Development Indicators
Female labour force participation rate41.2%2025World Bank World Development Indicators
Employment in services50.2%2025World Bank World Development Indicators
Wage and salaried workers54.6%2025World Bank World Development Indicators
Gross national income per person3,670USD/person2025World Bank World Development Indicators
Income inequality (Gini index)32.70–1002025World Bank World Development Indicators
Income share of the top 10%24.2%2025World Bank World Development Indicators
Extreme poverty rate2.3%2025UN SDG Indicators
Internet users89.5%2024UN SDG Indicators
Number of internet users32.5 millionpeople2024Calculated (household consumption ÷ population)
Mobile phone ownership84.8%2024UN SDG Indicators
Mobile subscriptions per 100 people110per 100 people2024World Bank World Development Indicators
Fixed broadband per 100 people34.7per 100 people2024World Bank World Development Indicators
Population covered by 4G97.0%2024UN SDG Indicators
Account ownership (bank or mobile money)59.7%2024World Bank World Development Indicators
Tertiary enrolment59.8%2025World Bank World Development Indicators
Go to downloads

Kazakhstan KAZ

National figures

FigureValueUnitYearSource
Population21.1 millionpeople2026UN World Population Prospects 2024
Population growth1.1%/year2026UN World Population Prospects 2024
Median age29.7years2026UN World Population Prospects 2024
Share aged 0–1428.9%2026UN World Population Prospects 2024
Share aged 15–6461.8%2026UN World Population Prospects 2024
Share aged 65+9.3%2026UN World Population Prospects 2024
People aged 15–345.7 millionpeople2026UN World Population Prospects 2024
Fertility rate2.9people2026UN World Population Prospects 2024
Life expectancy74.8years2026UN World Population Prospects 2024
Urban population share62.4%2025World Bank World Development Indicators
Population density7.8people/km²2026UN World Population Prospects 2024
Average household size3.4people2015UN Household Size and Composition
Household consumption169.2 billionUSD2025Asian Development Bank Key Indicators
Household consumption (local currency)88.2 trillionlocal currency2025Asian Development Bank Key Indicators
Household consumption (PPP)405.8 billioninternational $2024World Bank World Development Indicators
Household consumption per person8,118USD/person2025Calculated (household consumption ÷ population)
Household consumption per person (PPP)19,707international $/person2024Calculated (household consumption ÷ population)
Actual individual consumption per person (PPP)20,469international $/person2021World Bank International Comparison Program
Price level46.6index (world = 100)2021World Bank International Comparison Program
Food price level64.2index (world = 100)2021World Bank International Comparison Program
Household consumption growth8.1%/year2025Asian Development Bank Key Indicators
Household consumption share of GDP55.6%2025Asian Development Bank Key Indicators
Inflation (CPI)11.4%/year2025World Bank World Development Indicators
Exchange rate (local currency per USD)521local currency/USD2025World Bank World Development Indicators
GDP306.2 billionUSD2025World Bank World Development Indicators
GDP per person14,692USD/person2025World Bank World Development Indicators
GDP per person (PPP)44,293international $/person2025World Bank World Development Indicators
Economic growth6.5%/year2025World Bank World Development Indicators
Services share of the economy57.7%2025World Bank World Development Indicators
New business density3.3per 1,000 people2024World Bank World Development Indicators
International tourist arrivals11.1 millionpeople2025Asian Development Bank Key Indicators
Outbound departures2.9 millionpeople2020World Bank World Development Indicators
Unemployment rate4.8%2025World Bank World Development Indicators
Youth unemployment rate3.8%2025World Bank World Development Indicators
Labour force participation rate67.8%2025World Bank World Development Indicators
Female labour force participation rate62.6%2025World Bank World Development Indicators
Employment in services68.8%2025World Bank World Development Indicators
Wage and salaried workers73.9%2025World Bank World Development Indicators
Gross national income per person13,740USD/person2025World Bank World Development Indicators
Income inequality (Gini index)29.20–1002021World Bank World Development Indicators
Income share of the top 10%24.8%2021World Bank World Development Indicators
Extreme poverty rate0.00%2021UN SDG Indicators
Internet users93.4%2024UN SDG Indicators
Number of internet users19.2 millionpeople2024Calculated (household consumption ÷ population)
Mobile phone ownership93.8%2024UN SDG Indicators
Mobile subscriptions per 100 people127per 100 people2024World Bank World Development Indicators
Fixed broadband per 100 people15.3per 100 people2024World Bank World Development Indicators
Population covered by 4G91.6%2024UN SDG Indicators
Account ownership (bank or mobile money)87.0%2024World Bank World Development Indicators
Tertiary enrolment52.9%2025World Bank World Development Indicators
Go to downloads

Tajikistan TJK

National figures

FigureValueUnitYearSource
Population11.0 millionpeople2026UN World Population Prospects 2024
Population growth1.7%/year2026UN World Population Prospects 2024
Median age22.4years2026UN World Population Prospects 2024
Share aged 0–1435.4%2026UN World Population Prospects 2024
Share aged 15–6460.3%2026UN World Population Prospects 2024
Share aged 65+4.3%2026UN World Population Prospects 2024
People aged 15–343.6 millionpeople2026UN World Population Prospects 2024
Fertility rate3.0people2026UN World Population Prospects 2024
Life expectancy72.2years2026UN World Population Prospects 2024
Urban population share26.2%2025World Bank World Development Indicators
Population density76.7people/km²2026UN World Population Prospects 2024
Average household size6.2people2005UN Household Size and Composition
Household consumption13.5 billionUSD2025Asian Development Bank Key Indicators
Household consumption (local currency)135.5 billionlocal currency2025Asian Development Bank Key Indicators
Household consumption (PPP)25.2 billioninternational $2021World Bank World Development Indicators
Household consumption per person1,254USD/person2025Calculated (household consumption ÷ population)
Household consumption per person (PPP)2,533international $/person2021Calculated (household consumption ÷ population)
Actual individual consumption per person (PPP)3,421international $/person2021World Bank International Comparison Program
Price level37.1index (world = 100)2021World Bank International Comparison Program
Food price level71.2index (world = 100)2021World Bank International Comparison Program
Household consumption growth15.4%/year2024World Bank World Development Indicators
Household consumption share of GDP79.2%2025Asian Development Bank Key Indicators
Inflation (CPI)-0.09%/year2025Asian Development Bank Key Indicators
Exchange rate (local currency per USD)10.0local currency/USD2025World Bank World Development Indicators
GDP17.7 billionUSD2025World Bank World Development Indicators
GDP per person1,637USD/person2025World Bank World Development Indicators
GDP per person (PPP)5,923international $/person2025World Bank World Development Indicators
Economic growth8.4%/year2025World Bank World Development Indicators
Services share of the economy49.6%2025Asian Development Bank Key Indicators
New business density0.15per 1,000 people2018World Bank World Development Indicators
International tourist arrivals1.4 millionpeople2024Asian Development Bank Key Indicators
Outbound departures31,000people2018World Bank World Development Indicators
Unemployment rate6.9%2025World Bank World Development Indicators
Youth unemployment rate14.6%2025World Bank World Development Indicators
Labour force participation rate38.3%2025World Bank World Development Indicators
Female labour force participation rate21.9%2025World Bank World Development Indicators
Employment in services39.1%2025World Bank World Development Indicators
Wage and salaried workers68.7%2025World Bank World Development Indicators
Informal employment63.6%2016ILO ILOSTAT
Gross national income per person2,080USD/person2025World Bank World Development Indicators
Income inequality (Gini index)36.10–1002024World Bank World Development Indicators
Income share of the top 10%28.2%2024World Bank World Development Indicators
Extreme poverty rate6.1%2024UN SDG Indicators
Internet users55.8%2024UN SDG Indicators
Number of internet users5.9 millionpeople2024Calculated (household consumption ÷ population)
Mobile phone ownership70.7%2024UN SDG Indicators
Mobile subscriptions per 100 people76.2per 100 people2023World Bank World Development Indicators
Fixed broadband per 100 people0.98per 100 people2023World Bank World Development Indicators
Population covered by 4G84.7%2024UN SDG Indicators
Account ownership (bank or mobile money)54.5%2024World Bank World Development Indicators
Tertiary enrolment35.6%2024World Bank World Development Indicators
Go to downloads

Turkmenistan TKM

National figures

FigureValueUnitYearSource
Population7.7 millionpeople2026UN World Population Prospects 2024
Population growth1.5%/year2026UN World Population Prospects 2024
Median age27.3years2026UN World Population Prospects 2024
Share aged 0–1430.8%2026UN World Population Prospects 2024
Share aged 15–6464.1%2026UN World Population Prospects 2024
Share aged 65+5.1%2026UN World Population Prospects 2024
People aged 15–342.4 millionpeople2026UN World Population Prospects 2024
Fertility rate2.6people2026UN World Population Prospects 2024
Life expectancy70.5years2026UN World Population Prospects 2024
Urban population share47.1%2025World Bank World Development Indicators
Population density16.5people/km²2026UN World Population Prospects 2024
Average household size5.2people2019UN Household Size and Composition
Household consumption3.6 billionUSD2013Asian Development Bank Key Indicators
Household consumption (local currency)10.4 billionlocal currency2013Asian Development Bank Key Indicators
Household consumption (PPP)10.4 billioninternational $2012World Bank World Development Indicators
Household consumption per person614USD/person2013Calculated (household consumption ÷ population)
Household consumption per person (PPP)1,782international $/person2012Calculated (household consumption ÷ population)
Household consumption growth-61.4%/year2010Asian Development Bank Key Indicators
Household consumption share of GDP9.3%2013Asian Development Bank Key Indicators
Inflation (CPI)8.0%/year2025Asian Development Bank Key Indicators
Exchange rate (local currency per USD)3.5local currency/USD2025Asian Development Bank Key Indicators
GDP49.8 billionUSD2025World Bank World Development Indicators
GDP per person6,540USD/person2025World Bank World Development Indicators
GDP per person (PPP)22,602international $/person2025World Bank World Development Indicators
Economic growth6.3%/year2025World Bank World Development Indicators
Services share of the economy48.9%2025World Bank World Development Indicators
International tourist arrivals8,200people2007Asian Development Bank Key Indicators
Outbound departures38,000people2007World Bank World Development Indicators
Unemployment rate4.3%2025World Bank World Development Indicators
Youth unemployment rate10.0%2025World Bank World Development Indicators
Labour force participation rate42.0%2025World Bank World Development Indicators
Female labour force participation rate38.2%2025World Bank World Development Indicators
Employment in services49.5%2025World Bank World Development Indicators
Wage and salaried workers68.0%2025World Bank World Development Indicators
Gross national income per person6,340USD/person2025World Bank World Development Indicators
Income inequality (Gini index)40.80–1001998World Bank World Development Indicators
Income share of the top 10%31.5%1998World Bank World Development Indicators
Extreme poverty rate35.1%1998UN SDG Indicators
Internet users21.3%2017Asian Development Bank Key Indicators
Number of internet users1.4 millionpeople2017Calculated (household consumption ÷ population)
Mobile phone ownership86.1%2024UN SDG Indicators
Mobile subscriptions per 100 people88.2per 100 people2021World Bank World Development Indicators
Fixed broadband per 100 people5.2per 100 people2022World Bank World Development Indicators
Population covered by 4G80.0%2024UN SDG Indicators
Account ownership (bank or mobile money)40.6%2017World Bank World Development Indicators
Tertiary enrolment20.4%2024World Bank World Development Indicators
Go to downloads

Kyrgyzstan KGZ

National figures

FigureValueUnitYearSource
Population7.4 millionpeople2026UN World Population Prospects 2024
Population growth1.4%/year2026UN World Population Prospects 2024
Median age25.5years2026UN World Population Prospects 2024
Share aged 0–1431.4%2026UN World Population Prospects 2024
Share aged 15–6462.3%2026UN World Population Prospects 2024
Share aged 65+6.3%2026UN World Population Prospects 2024
People aged 15–342.3 millionpeople2026UN World Population Prospects 2024
Fertility rate2.7people2026UN World Population Prospects 2024
Life expectancy72.1years2026UN World Population Prospects 2024
Urban population share34.7%2025World Bank World Development Indicators
Population density38.6people/km²2026UN World Population Prospects 2024
Average household size4.0people2018UN Household Size and Composition
Household consumption21.1 billionUSD2025World Bank World Development Indicators
Household consumption (local currency)1.8 trillionlocal currency2025World Bank World Development Indicators
Household consumption (PPP)62.9 billioninternational $2025World Bank World Development Indicators
Household consumption per person2,895USD/person2025Calculated (household consumption ÷ population)
Household consumption per person (PPP)8,624international $/person2025Calculated (household consumption ÷ population)
Actual individual consumption per person (PPP)5,270international $/person2021World Bank International Comparison Program
Price level38.3index (world = 100)2021World Bank International Comparison Program
Food price level67.4index (world = 100)2021World Bank International Comparison Program
Household consumption growth23.8%/year2025World Bank World Development Indicators
Household consumption share of GDP93.3%2025World Bank World Development Indicators
Inflation (CPI)8.2%/year2025World Bank World Development Indicators
Exchange rate (local currency per USD)87.2local currency/USD2024World Bank World Development Indicators
GDP22.6 billionUSD2025World Bank World Development Indicators
GDP per person3,081USD/person2025World Bank World Development Indicators
GDP per person (PPP)9,220international $/person2025World Bank World Development Indicators
Economic growth11.1%/year2025World Bank World Development Indicators
Services share of the economy51.2%2025World Bank World Development Indicators
New business density2.2per 1,000 people2024World Bank World Development Indicators
International tourist arrivals8.6 millionpeople2023Asian Development Bank Key Indicators
Outbound departures5.3 millionpeople2019World Bank World Development Indicators
Unemployment rate3.5%2025World Bank World Development Indicators
Youth unemployment rate8.2%2025World Bank World Development Indicators
Labour force participation rate57.4%2025World Bank World Development Indicators
Female labour force participation rate44.1%2025World Bank World Development Indicators
Employment in services57.7%2025World Bank World Development Indicators
Wage and salaried workers69.5%2025World Bank World Development Indicators
Informal employment57.5%2023ILO ILOSTAT
Gross national income per person2,800USD/person2025World Bank World Development Indicators
Income inequality (Gini index)27.50–1002024World Bank World Development Indicators
Income share of the top 10%22.9%2024World Bank World Development Indicators
Extreme poverty rate2.2%2024UN SDG Indicators
Internet users92.0%2024UN SDG Indicators
Number of internet users6.6 millionpeople2024Calculated (household consumption ÷ population)
Mobile phone ownership93.8%2024UN SDG Indicators
Mobile subscriptions per 100 people107per 100 people2024World Bank World Development Indicators
Fixed broadband per 100 people7.8per 100 people2024World Bank World Development Indicators
Population covered by 4G99.4%2024UN SDG Indicators
Account ownership (bank or mobile money)72.3%2024World Bank World Development Indicators
Tertiary enrolment53.9%2025World Bank World Development Indicators
Go to downloads

Oceania and the Pacific

Australia AUS

National figures

IndicatorValueYearSource
Population27.23 million people2026UN World Population Prospects 2024
People aged 15–347.06 million people2026UN World Population Prospects 2024
Median age38.52 years old2026UN World Population Prospects 2024
Share of people living in cities87.72 %2025World Bank WDI
Household consumption per 1 person (price-adjusted)36,475 International dollars2025Calculated
GDP per 1 person (price-adjusted)71,934 International dollars2025World Bank WDI
Total household consumption (price-adjusted)983.88 billion International dollars2025World Bank WDI
Price level of everyday goods (world average =100)177.4 2021World Bank ICP
Inflation (1 year)2.87 %2025World Bank WDI
Economic growth (1 year)1.35 %2025World Bank WDI
Share of people using the internet96.1 %2024UN SDG
Share of people with an account or mobile money98.01 %2024World Bank WDI
International visitors8.27 million people2024Asian Development Bank KIDB
Income inequality (Gini coefficient)33.8 2020World Bank WDI
Unemployment rate4.17 %2025ILO

Figures by state (9 states)

Sorted by population. “―” means there is no figure, or the figure is not published here because its terms of use are unclear.

statesPopulation
people · 2026
Population per 1km² (population density)
people/km² · 2026
Share of people aged 0–14
% · 2026
Share of people aged 65+
% · 2026
Prosperity: household disposable income per 1 person
Australian dollars/person/year (nominal) · 2022
Share of household spending on food and non-alcoholic beverages
% · 2015-16
New South Wales8.67 million10.817.1718.1859,3809.44
Victoria7.15 million31.417.1117.1652,30810.49
Queensland5.74 million3.317.4517.6154,21810.44
Western Australia3.10 million1.217.5116.4562,32010.87
South Australia1.92 million1.916.1520.7350,55311.71
Tasmania580,6918.515.7122.7351,94711.52
Australian Capital Territory489,668207.716.9414.2592,2319.84
Northern Territory268,8990.219.879.7871,5149.32
Other Territories――――――

Current economy (monthly)

IndicatorLatest valueMonthSource
Business confidence (OECD, 100=long-term average)99.712026-05OECD
Consumer confidence (OECD, 100= long-term average)98.652026-08OECD
Household spending (value, year on year)7.452026-07Australian Bureau of Statistics (ABS Data API)
Unemployment rate (seasonally adjusted)4.432026-07World Bank

Culture

Religion (2021, Australian Bureau of Statistics 2021 Census G14 (ABS Data API)): No religion 38.4%, Catholic 20%, Anglican (Church of England tradition) 9.8%, No answer 7.3%, Islam 3.2%

Languages (2021, Australian Bureau of Statistics 2021 Census G13 (ABS Data API)): English (speaks only English) 72%, No answer 5.7%, Other languages 3.3%, Chinese (Standard Mandarin) 2.7%, Arabic 1.4%

Source

The figures on this page come from the following public statistics. On the 3D map, click a number to see, for each one, the URL of the original file, the location inside it, the text exactly as written, the date fetched, the file fingerprint (sha256), and for calculated numbers, the formula and inputs.

  • Australian Bureau of Statistics, Household Expenditure Survey, Australia: Summary of Results, 2015-16 (6530.0) data cube 12 (COICOP) / 13 (states and territories) (CC BY 4.0 (© Commonwealth of Australia))
  • Australian Bureau of Statistics (ABS Data API) (CC BY 4.0 (abs.gov.au))
  • ILO (CC BY 4.0)
  • OECD (OECD terms of use (use permitted with attribution))
  • World Bank (CC BY 4.0)
  • Asian Development Bank KIDB (CC BY 3.0 IGO)
  • Australian Bureau of Statistics 2021 Census G13 (ABS Data API) (open_licence)
  • Australian Bureau of Statistics 2021 Census G14 (ABS Data API) (open_licence)
  • World Bank ICP (CC BY 4.0)
  • World Bank WDI (CC BY 4.0)
  • Tables from national statistics offices and ministries (24 newly fetched datasets) and tables already in the warehouse (e-Stat, OpenDOSM, National Statistical Office of Thailand, Brunei DEPS, Pakistan Bureau of Statistics, OCHA common datasets, OECD regional database, Pacific Community)
  • UN SDG (UN)
  • UN World Population Prospects 2024 (CC BY 3.0 IGO)
  • Calculated
Go to this country’s CSV

Papua New Guinea PNG

National figures

IndicatorValueYearSource
Population10.95 million people2026UN World Population Prospects 2024
People aged 15–343.84 million people2026UN World Population Prospects 2024
Median age23.01 years old2026UN World Population Prospects 2024
Share of people living in cities15.78 %2025World Bank WDI
Household consumption per 1 person (price-adjusted)873.7 International dollars2004Calculated
GDP per 1 person (price-adjusted)5,215 International dollars2025World Bank WDI
Total household consumption (price-adjusted)5.53 billion International dollars2004World Bank WDI
Inflation (1 year)4.42 %2025World Bank WDI
Economic growth (1 year)5.64 %2025World Bank WDI
Share of people using the internet18.8 %2024UN SDG
International visitors99,000 people2024Asian Development Bank KIDB
Income inequality (Gini coefficient)41.9 2009World Bank WDI
Unemployment rate2.57 %2025World Bank WDI

Figures by state/province (22 states/provinces)

Sorted by population. “―” means there is no figure, or the figure is not published here because its terms of use are unclear.

states/provincesProsperity: share of people in the nation's richest 1/5
% (of people in the area) · 2017
National Capital District95.3
Morobe Province38.3
Central Province32.9
Manus Province28.5
West New Britain Province27.9
Chimbu (Simbu) Province27.7
East New Britain Province27.3
Western Highlands Province21.6
Eastern Highlands Province17
Jiwaka Province16.2
Northern (Oro) Province16
Autonomous Region of Bougainville15.3
New Ireland Province14.9
Western Province14.3
West Sepik (Sandaun) Province12.8
Milne Bay Province12.2
Enga Province11.1
East Sepik Province10.6
Gulf Province9.8
Madang Province7.4
Southern Highlands Province6.7
Hela Province2.3

Culture

Religion (2020, Pew Research Center 2025「Religious Composition by Country, 2010-2020」): Christianity 99.1%, Other religions (Sikhism, Taoism, Shinto, Jainism, Bahá'í, folk religions, etc.) 0.5%, No religion (no particular faith) 0.3%, Islam 0.1%, Buddhism 0%

Source

The figures on this page come from the following public statistics. On the 3D map, click a number to see, for each one, the URL of the original file, the location inside it, the text exactly as written, the date fetched, the file fingerprint (sha256), and for calculated numbers, the formula and inputs.

  • Pew Research Center 2025「Religious Composition by Country, 2010-2020」 (terms_attribution)
  • The DHS Program (USAID) STATcompiler API (Aggregate tables may be used with source credit (DHS terms of use))
  • Asian Development Bank KIDB (CC BY 3.0 IGO)
  • World Bank WDI (CC BY 4.0)
  • UN SDG (UN)
  • UN World Population Prospects 2024 (CC BY 3.0 IGO)
  • Calculated
Go to this country’s CSV

New Zealand NZL

National figures

IndicatorValueYearSource
Population5.29 million people2026UN World Population Prospects 2024
People aged 15–341.40 million people2026UN World Population Prospects 2024
Median age37.99 years old2026UN World Population Prospects 2024
Share of people living in cities84 %2025World Bank WDI
Household consumption per 1 person (price-adjusted)31,468 International dollars2024Calculated
GDP per 1 person (price-adjusted)57,350 International dollars2025World Bank WDI
Total household consumption (price-adjusted)164.07 billion International dollars2024World Bank WDI
Price level of everyday goods (world average =100)156.1 2021World Bank ICP
Inflation (1 year)2.84 %2025World Bank WDI
Economic growth (1 year)0.46 %2025World Bank WDI
Share of people using the internet93.5 %2024UN SDG
Share of people with an account or mobile money97.86 %2024World Bank WDI
International visitors3.18 million people2024Asian Development Bank KIDB
Income inequality (Gini coefficient)32.6 2022Asian Development Bank KIDB
Unemployment rate5.26 %2025ILO

Figures by region (15 regions)

Sorted by population. “―” means there is no figure, or the figure is not published here because its terms of use are unclear.

regionsPopulation
people · 2025
Population per 1km² (population density)
people/km² · 2025
Share of people aged 0–14
% · 2025
Share of people aged 65+
% · 2025
Affluence: gross regional product per 1 person
NZ dollars/person/year (nominal) · 2024
Share of household spending on food and non-alcoholic beverages
% · 2022-23
Auckland Region1.82 million367.618.6813.4489,52118.28
Canterbury Region698,20015.717.1317.7579,85216.98
Wellington543,40067.516.7116.1894,43817.53
Waikato Region532,10022.319.7117.5572,330―
Bay of Plenty Region351,50029.119.4319.6371,343―
Manawatū-Whanganui Region260,70011.718.8720.165,844―
Otago Region253,9008.115.1218.1676,101―
Northland Region201,10016.119.0922.6357,992―
Hawke's Bay Region179,70012.719.3119.8169,966―
Tasman-Nelson-Marlborough165,0008.115.9423.8272,908―
Taranaki Region130,3001819.4219.885,095―
Southland Region104,8003.418.4218.895,061―
Gisborne District52,7006.321.4417.0858,588―
West Coast Region34,7001.515.8523.9277,650―
Chatham Islands Territory――――――

Current economy (monthly)

IndicatorLatest valueMonthSource
Business confidence (OECD, 100=long-term average)100.12026-06OECD
Consumer confidence (OECD, 100= long-term average)96.932026-06OECD
Retail card payments (value, year on year)0.162026-08Stats NZ (CSV files for download)
Unemployment rate (seasonally adjusted)5.422026-06World Bank

Culture

Religion (2023, Stats NZ 2023 Census (summed from statistical areas SA2)): No religion 51.6%, Christianity 32.3%, Refused to answer 6.9%, Hinduism 2.9%, Other religions and beliefs 2%

Languages (2023, Stats NZ 2023 Census (summed from statistical areas SA2)): English 95.1%, Other languages 17.6%, Māori 4.3%, Samoan 2.2%, No language spoken (e.g. young children) 2.1%

Source

The figures on this page come from the following public statistics. On the 3D map, click a number to see, for each one, the URL of the original file, the location inside it, the text exactly as written, the date fetched, the file fingerprint (sha256), and for calculated numbers, the formula and inputs.

  • ILO (CC BY 4.0)
  • OECD (OECD terms of use (use permitted with attribution))
  • Stats NZ, Household expenditure statistics: Year ended June 2023 (Table 2) (CC BY 4.0 International (Stats NZ))
  • Stats NZ (CSV files for download) (CC BY 4.0)
  • Stats NZ (Tatauranga Aotearoa)Subnational population estimates: At 30 June 2025 (provisional) (CC BY 4.0 (stats.govt.nz))
  • World Bank (CC BY 4.0)
  • Asian Development Bank KIDB (CC BY 3.0 IGO)
  • Stats NZ 2023 Census (summed from statistical areas SA2) (open_licence)
  • World Bank ICP (CC BY 4.0)
  • World Bank WDI (CC BY 4.0)
  • Tables from national statistics offices and ministries (24 newly fetched datasets) and tables already in the warehouse (e-Stat, OpenDOSM, National Statistical Office of Thailand, Brunei DEPS, Pakistan Bureau of Statistics, OCHA common datasets, OECD regional database, Pacific Community)
  • UN SDG (UN)
  • UN World Population Prospects 2024 (CC BY 3.0 IGO)
  • Calculated
Go to this country’s CSV

Fiji FJI

National figures

IndicatorValueYearSource
Population937,282 people2026UN World Population Prospects 2024
People aged 15–34302,270 people2026UN World Population Prospects 2024
Median age28.27 years old2026UN World Population Prospects 2024
Share of people living in cities59.54 %2025World Bank WDI
Household consumption per 1 person (price-adjusted)11,075 International dollars2024Calculated
GDP per 1 person (price-adjusted)16,338 International dollars2025World Bank WDI
Total household consumption (price-adjusted)10.29 billion International dollars2024World Bank WDI
Price level of everyday goods (world average =100)67.74 2021World Bank ICP
Inflation (1 year)-1.38 %2025World Bank WDI
Economic growth (1 year)3.2 %2025World Bank WDI
Share of people using the internet74.7 %2024UN SDG
International visitors986,000 people2025Asian Development Bank KIDB
Income inequality (Gini coefficient)30.7 2019World Bank WDI
Unemployment rate5.35 %2025World Bank WDI

Figures by state/province (4 states/provinces)

Sorted by population. “―” means there is no figure, or the figure is not published here because its terms of use are unclear.

states/provincesPopulation
people · 2017
Population per 1km² (population density)
people/km² · 2017
Share of people aged 0–14
% · 2017
Share of people aged 65+
% · 2017
Central378,28488.128.925.24
Western337,0415328.165.8
Northern Division131,91421.331.826.05
Eastern37,64826.535.886.65

Current economy (monthly)

IndicatorLatest valueMonthSource
Inflation (compared with the same month a year earlier)-2.442025-08World Bank

Culture

Religion (2020, Pew Research Center 2025「Religious Composition by Country, 2010-2020」): Christianity 69.5%, Hinduism 24.1%, Islam 5.8%, Other religions (Sikhism, Taoism, Shinto, Jainism, Bahá'í, folk religions, etc.) 0.3%, No religion (no particular faith) 0.3%

Source

The figures on this page come from the following public statistics. On the 3D map, click a number to see, for each one, the URL of the original file, the location inside it, the text exactly as written, the date fetched, the file fingerprint (sha256), and for calculated numbers, the formula and inputs.

  • Pew Research Center 2025「Religious Composition by Country, 2010-2020」 (terms_attribution)
  • UN OCHA Humanitarian Data Exchange (Varies by dataset (mostly CC BY / CC BY-IGO). Check the dataset page before use.)
  • World Bank (CC BY 4.0)
  • Asian Development Bank KIDB (CC BY 3.0 IGO)
  • World Bank ICP (CC BY 4.0)
  • World Bank WDI (CC BY 4.0)
  • Tables from national statistics offices and ministries (24 newly fetched datasets) and tables already in the warehouse (e-Stat, OpenDOSM, National Statistical Office of Thailand, Brunei DEPS, Pakistan Bureau of Statistics, OCHA common datasets, OECD regional database, Pacific Community)
  • UN SDG (UN)
  • UN World Population Prospects 2024 (CC BY 3.0 IGO)
  • Calculated
Go to this country’s CSV

Solomon Islands SLB

National figures

IndicatorValueYearSource
Population858,288 people2026UN World Population Prospects 2024
People aged 15–34294,618 people2026UN World Population Prospects 2024
Median age20.92 years old2026UN World Population Prospects 2024
Share of people living in cities31.31 %2025World Bank WDI
Household consumption per 1 person (price-adjusted)1,762 International dollars2024Calculated
GDP per 1 person (price-adjusted)2,788 International dollars2025World Bank WDI
Total household consumption (price-adjusted)1.44 billion International dollars2024World Bank WDI
Inflation (1 year)3.36 %2025World Bank WDI
Economic growth (1 year)3.62 %2025World Bank WDI
Share of people using the internet29 %2024UN SDG
International visitors28,500 people2025Asian Development Bank KIDB
Income inequality (Gini coefficient)37.1 2012World Bank WDI
Unemployment rate1.43 %2025World Bank WDI

Figures by state/province (10 states/provinces)

Sorted by population. “―” means there is no figure, or the figure is not published here because its terms of use are unclear.

states/provincesAffluence: average annual income per 1 household
Solomon Islands dollars/household per year (nominal) · 2012
Honiara165,305
Central73,184
Choiseul Island70,982
Guadalcanal Province65,788
Western57,060
Temotu52,772
Rennell and Bellona Province51,784
Malaita Province51,780
Isabel46,607
Makira-Ulawa Province40,527

Current economy (monthly)

IndicatorLatest valueMonthSource
Inflation (compared with the same month a year earlier)2.652019-12World Bank

Culture

Religion (2020, Pew Research Center 2025「Religious Composition by Country, 2010-2020」): Christianity 95%, Other religions (Sikhism, Taoism, Shinto, Jainism, Bahá'í, folk religions, etc.) 4%, Islam 0.3%, Buddhism 0.3%, No religion (no particular faith) 0.3%

Source

The figures on this page come from the following public statistics. On the 3D map, click a number to see, for each one, the URL of the original file, the location inside it, the text exactly as written, the date fetched, the file fingerprint (sha256), and for calculated numbers, the formula and inputs.

  • Pacific Community (SPC) Pacific Data Hub .Stat (CC BY 4.0)
  • Pew Research Center 2025「Religious Composition by Country, 2010-2020」 (terms_attribution)
  • World Bank (CC BY 4.0)
  • Asian Development Bank KIDB (CC BY 3.0 IGO)
  • World Bank WDI (CC BY 4.0)
  • UN SDG (UN)
  • UN World Population Prospects 2024 (CC BY 3.0 IGO)
  • Calculated
Go to this country’s CSV

Vanuatu VUT

National figures

IndicatorValueYearSource
Population342,564 people2026UN World Population Prospects 2024
People aged 15–34111,891 people2026UN World Population Prospects 2024
Median age20.35 years old2026UN World Population Prospects 2024
Share of people living in cities22.32 %2025World Bank WDI
Household consumption per 1 person (price-adjusted)2,844 International dollars2024Calculated
GDP per 1 person (price-adjusted)4,525 International dollars2025World Bank WDI
Total household consumption (price-adjusted)932.15 million International dollars2024World Bank WDI
Inflation (1 year)0.66 %2025World Bank WDI
Economic growth (1 year)3.05 %2025World Bank WDI
Share of people using the internet22.4 %2015UN SDG
International visitors96,000 people2025Asian Development Bank KIDB
Income inequality (Gini coefficient)32.3 2019World Bank WDI
Unemployment rate1.41 %2025ILO

Figures by state/province (6 states/provinces)

Sorted by population. “―” means there is no figure, or the figure is not published here because its terms of use are unclear.

states/provincesAffluence: average annual income per 1 household
Baht/household per year (nominal) · 2019
Shefa1.72 million
Penama1.43 million
Sanma1.03 million
Malampa735,844
Torba729,144
Tafea631,698

Culture

Religion (2020, Pew Research Center 2025「Religious Composition by Country, 2010-2020」): Christianity 83.5%, Other religions (Sikhism, Taoism, Shinto, Jainism, Bahá'í, folk religions, etc.) 15.1%, No religion (no particular faith) 1.4%, Islam 0%, Hinduism 0%

Source

The figures on this page come from the following public statistics. On the 3D map, click a number to see, for each one, the URL of the original file, the location inside it, the text exactly as written, the date fetched, the file fingerprint (sha256), and for calculated numbers, the formula and inputs.

  • ILO (CC BY 4.0)
  • Pacific Community (SPC) Pacific Data Hub .Stat (CC BY 4.0)
  • Pew Research Center 2025「Religious Composition by Country, 2010-2020」 (terms_attribution)
  • Asian Development Bank KIDB (CC BY 3.0 IGO)
  • World Bank WDI (CC BY 4.0)
  • UN SDG (UN)
  • UN World Population Prospects 2024 (CC BY 3.0 IGO)
  • Calculated
Go to this country’s CSV

Samoa WSM

National figures

FigureValueUnitYearSource
Population220,528people2026UN World Population Prospects 2024
Population growth0.56%/year2026UN World Population Prospects 2024
Median age19.8years2026UN World Population Prospects 2024
Share aged 0–1437.5%2026UN World Population Prospects 2024
Share aged 15–6456.2%2026UN World Population Prospects 2024
Share aged 65+6.2%2026UN World Population Prospects 2024
People aged 15–3467,563people2026UN World Population Prospects 2024
Fertility rate3.7people2026UN World Population Prospects 2024
Life expectancy72.1years2026UN World Population Prospects 2024
Urban population share17.5%2025World Bank World Development Indicators
Population density77.9people/km²2026UN World Population Prospects 2024
Average household size6.6people2019UN Household Size and Composition
Household consumption937 millionUSD2025World Bank World Development Indicators
Household consumption (local currency)2.6 billionlocal currency2025World Bank World Development Indicators
Household consumption (PPP)1.4 billioninternational $2025World Bank World Development Indicators
Household consumption per person4,274USD/person2025Calculated (household consumption ÷ population)
Household consumption per person (PPP)6,322international $/person2025Calculated (household consumption ÷ population)
Household consumption growth-5.1%/year2025World Bank World Development Indicators
Household consumption share of GDP72.8%2025World Bank World Development Indicators
Inflation (CPI)2.2%/year2025World Bank World Development Indicators
Exchange rate (local currency per USD)2.8local currency/USD2025World Bank World Development Indicators
GDP1.3 billionUSD2025World Bank World Development Indicators
GDP per person5,873USD/person2025World Bank World Development Indicators
GDP per person (PPP)9,319international $/person2025World Bank World Development Indicators
Economic growth4.2%/year2025World Bank World Development Indicators
Services share of the economy72.1%2025World Bank World Development Indicators
New business density0.72per 1,000 people2022World Bank World Development Indicators
International tourist arrivals177,000people2025Asian Development Bank Key Indicators
Outbound departures18,500people2020World Bank World Development Indicators
Unemployment rate5.0%2025World Bank World Development Indicators
Youth unemployment rate13.0%2025World Bank World Development Indicators
Labour force participation rate42.5%2025World Bank World Development Indicators
Female labour force participation rate30.7%2025World Bank World Development Indicators
Employment in services57.2%2025World Bank World Development Indicators
Wage and salaried workers55.5%2025World Bank World Development Indicators
Informal employment51.5%2022ILO ILOSTAT
Gross national income per person5,640USD/person2025World Bank World Development Indicators
Income inequality (Gini index)38.70–1002013World Bank World Development Indicators
Income share of the top 10%31.3%2013World Bank World Development Indicators
Extreme poverty rate4.5%2013UN SDG Indicators
Internet users21.2%2014UN SDG Indicators
Number of internet users42,408people2014Calculated (household consumption ÷ population)
Mobile phone ownership70.3%2020UN SDG Indicators
Mobile subscriptions per 100 people62.4per 100 people2022World Bank World Development Indicators
Fixed broadband per 100 people0.88per 100 people2022World Bank World Development Indicators
Population covered by 4G99.0%2024UN SDG Indicators
Tertiary enrolment16.0%2024World Bank World Development Indicators
Go to downloads

Kiribati KIR

National figures

IndicatorValueYearSource
Population138,445 people2026UN World Population Prospects 2024
People aged 15–3446,444 people2026UN World Population Prospects 2024
Median age23.02 years old2026UN World Population Prospects 2024
Share of people living in cities63.39 %2025World Bank WDI
Household consumption per 1 person (price-adjusted)4,294 International dollars2024Calculated
GDP per 1 person (price-adjusted)3,937 International dollars2025World Bank WDI
Total household consumption (price-adjusted)577.65 million International dollars2024World Bank WDI
Inflation (1 year)5.1 %2025Asian Development Bank KIDB
Economic growth (1 year)4.22 %2025World Bank WDI
Share of people using the internet89.4 %2024UN SDG
International visitors8,200 people2023Asian Development Bank KIDB
Income inequality (Gini coefficient)24.7 2023World Bank WDI
Unemployment rate2.79 %2023ILO

Figures by state/province (3 states/provinces)

Sorted by population. “―” means there is no figure, or the figure is not published here because its terms of use are unclear.

states/provincesPopulation
people · 2020
Population per 1km² (population density)
people/km² · 2020
Share of people aged 0–14
% · 2020
Share of people aged 65+
% · 2020
Affluence: average annual income per 1 household
Australian dollars/household/year (nominal) · 2019
Gilbert Islands108,661380.335.593.9216,757
Line Islands11,27922.739.232.9616,077
Phoenix Islands0――――

Current economy (monthly)

IndicatorLatest valueMonthSource
Inflation (compared with the same month a year earlier)-1.252019-12World Bank

Culture

Religion (2020, Pew Research Center 2025「Religious Composition by Country, 2010-2020」): Christianity 97.6%, Other religions (Sikhism, Taoism, Shinto, Jainism, Bahá'í, folk religions, etc.) 2.2%, No religion (no particular faith) 0.1%, Islam 0.1%, Hinduism 0%

Source

The figures on this page come from the following public statistics. On the 3D map, click a number to see, for each one, the URL of the original file, the location inside it, the text exactly as written, the date fetched, the file fingerprint (sha256), and for calculated numbers, the formula and inputs.

  • ILO (CC BY 4.0)
  • Pacific Community (SPC) Pacific Data Hub .Stat (CC BY 4.0)
  • Pew Research Center 2025「Religious Composition by Country, 2010-2020」 (terms_attribution)
  • UN OCHA Humanitarian Data Exchange (Varies by dataset (mostly CC BY / CC BY-IGO). Check the dataset page before use.)
  • World Bank (CC BY 4.0)
  • Asian Development Bank KIDB (CC BY 3.0 IGO)
  • World Bank WDI (CC BY 4.0)
  • Tables from national statistics offices and ministries (24 newly fetched datasets) and tables already in the warehouse (e-Stat, OpenDOSM, National Statistical Office of Thailand, Brunei DEPS, Pakistan Bureau of Statistics, OCHA common datasets, OECD regional database, Pacific Community)
  • UN SDG (UN)
  • UN World Population Prospects 2024 (CC BY 3.0 IGO)
  • Calculated
Go to this country’s CSV

Federated States of Micronesia FSM

National figures

IndicatorValueYearSource
Population114,182 people2026UN World Population Prospects 2024
People aged 15–3441,677 people2026UN World Population Prospects 2024
Median age23.49 years old2026UN World Population Prospects 2024
Share of people living in cities22.48 %2025World Bank WDI
GDP per 1 person (price-adjusted)4,604 International dollars2025World Bank WDI
Inflation (1 year)2.22 %2025Asian Development Bank KIDB
Economic growth (1 year)1.06 %2025World Bank WDI
Share of people using the internet39.5 %2024UN SDG
International visitors2,000 people2023Asian Development Bank KIDB
Income inequality (Gini coefficient)40.1 2013World Bank WDI
Unemployment rate8.86 %2014Asian Development Bank KIDB

Source

The figures on this page come from the following public statistics. On the 3D map, click a number to see, for each one, the URL of the original file, the location inside it, the text exactly as written, the date fetched, the file fingerprint (sha256), and for calculated numbers, the formula and inputs.

  • Asian Development Bank KIDB (CC BY 3.0 IGO)
  • World Bank WDI (CC BY 4.0)
  • UN SDG (UN)
  • UN World Population Prospects 2024 (CC BY 3.0 IGO)
Go to this country’s CSV

Tonga TON

National figures

FigureValueUnitYearSource
Population103,291people2026UN World Population Prospects 2024
Population growth-0.43%/year2026UN World Population Prospects 2024
Median age21.0years2026UN World Population Prospects 2024
Share aged 0–1434.4%2026UN World Population Prospects 2024
Share aged 15–6458.6%2026UN World Population Prospects 2024
Share aged 65+7.0%2026UN World Population Prospects 2024
People aged 15–3433,462people2026UN World Population Prospects 2024
Fertility rate3.0people2026UN World Population Prospects 2024
Life expectancy73.4years2026UN World Population Prospects 2024
Urban population share21.2%2025World Bank World Development Indicators
Population density159people/km²2026UN World Population Prospects 2024
Average household size5.3people2019UN Household Size and Composition
Household consumption623 millionUSD2024World Bank World Development Indicators
Household consumption (local currency)1.5 billionlocal currency2024World Bank World Development Indicators
Household consumption (PPP)810 millioninternational $2024World Bank World Development Indicators
Household consumption per person5,980USD/person2024Calculated (household consumption ÷ population)
Household consumption per person (PPP)7,777international $/person2024Calculated (household consumption ÷ population)
Household consumption growth1.3%/year2024World Bank World Development Indicators
Household consumption share of GDP96.2%2024World Bank World Development Indicators
Inflation (CPI)5.6%/year2025World Bank World Development Indicators
Exchange rate (local currency per USD)2.4local currency/USD2025World Bank World Development Indicators
GDP679 millionUSD2025World Bank World Development Indicators
GDP per person6,547USD/person2025World Bank World Development Indicators
GDP per person (PPP)8,675international $/person2025World Bank World Development Indicators
Economic growth2.8%/year2025World Bank World Development Indicators
Services share of the economy49.5%2024World Bank World Development Indicators
New business density0.70per 1,000 people2024World Bank World Development Indicators
International tourist arrivals64,200people2025Asian Development Bank Key Indicators
Unemployment rate2.0%2025World Bank World Development Indicators
Youth unemployment rate6.0%2025World Bank World Development Indicators
Labour force participation rate49.8%2025World Bank World Development Indicators
Female labour force participation rate42.3%2025World Bank World Development Indicators
Employment in services53.0%2025World Bank World Development Indicators
Wage and salaried workers58.2%2025World Bank World Development Indicators
Informal employment59.2%2023ILO ILOSTAT
Gross national income per person6,840USD/person2025World Bank World Development Indicators
Income inequality (Gini index)27.10–1002021World Bank World Development Indicators
Income share of the top 10%22.0%2021World Bank World Development Indicators
Extreme poverty rate0.40%2021UN SDG Indicators
Internet users67.4%2024UN SDG Indicators
Number of internet users70,215people2024Calculated (household consumption ÷ population)
Mobile phone ownership73.0%2024UN SDG Indicators
Mobile subscriptions per 100 people61.7per 100 people2022World Bank World Development Indicators
Fixed broadband per 100 people8.2per 100 people2022World Bank World Development Indicators
Population covered by 4G96.0%2024UN SDG Indicators
Tertiary enrolment42.9%2023World Bank World Development Indicators
Go to downloads

Marshall Islands MHL

National figures

IndicatorValueYearSource
Population35,075 people2026UN World Population Prospects 2024
People aged 15–3410,921 people2026UN World Population Prospects 2024
Median age20.48 years old2026UN World Population Prospects 2024
Share of people living in cities79.11 %2025World Bank WDI
Household consumption per 1 person (price-adjusted)4,349 International dollars2021Calculated
GDP per 1 person (price-adjusted)8,964 International dollars2025World Bank WDI
Total household consumption (price-adjusted)179.92 million International dollars2021World Bank WDI
Inflation (1 year)7.47 %2023Asian Development Bank KIDB
Economic growth (1 year)2.28 %2025World Bank WDI
Share of people using the internet65.9 %2024UN SDG
International visitors6,050 people2023Asian Development Bank KIDB
Income inequality (Gini coefficient)35.5 2019World Bank WDI
Unemployment rate9.82 %2021ILO

Figures by state/province (25 states/provinces)

Sorted by population. “―” means there is no figure, or the figure is not published here because its terms of use are unclear.

states/provincesPopulation
people · 2011
Population per 1km² (population density)
people/km² · 2011
Share of people aged 0–14
% · 2011
Share of people aged 65+
% · 2011
Majuro27,7972,86336.392.19
Kwajalein11,408696.041.161.49
Arno1,794138.551.780.89
Jaluit1,788157.742.112.57
Ailinglaplap1,729117.750.322.83
Wotje859.0105.038.881.86
Namu780.0124.440.92.31
Mili738.046.3501.08
Ebon706.0122.844.622.69
Maloelap682.069.546.332.05
Enewetak664.0113.549.11.36
Kili548.0589.242.522.19
Namdrik508.0183.451.182.76
Aur499.088.842.282.61
Utirik435.0179.045.520.92
Likiep401.03947.634.49
Ujae364.0195.747.252.75
Mejit348.0187.143.971.44
Lae347.0239.349.570.86
Ailuk339.063.245.131.77
Lib155.0166.755.480.65
Wotho9722.445.361.03
Jabat84147.444.051.19
Rongelap799.91.271.27
Eneu91.500

Culture

Religion (1999, UNdata UN Demographic Yearbook: population by religion (census)): Protestant 54.8%, Assemblies of God 25.8%, Other 11.1%, Roman Catholic 8.4%

Languages (1999, UNdata UN Demographic Yearbook: population by language (census)): Marshallese 98.4%, English 53.8%, Other languages 1.6%, Micronesian languages 1.4%, Other Pacific Island languages 1.3%

Source

The figures on this page come from the following public statistics. On the 3D map, click a number to see, for each one, the URL of the original file, the location inside it, the text exactly as written, the date fetched, the file fingerprint (sha256), and for calculated numbers, the formula and inputs.

  • ILO (CC BY 4.0)
  • UN OCHA Humanitarian Data Exchange (Varies by dataset (mostly CC BY / CC BY-IGO). Check the dataset page before use.)
  • UNdata UN Demographic Yearbook: population by religion (census) (terms_attribution)
  • UNdata UN Demographic Yearbook: population by language (census) (terms_attribution)
  • Asian Development Bank KIDB (CC BY 3.0 IGO)
  • World Bank WDI (CC BY 4.0)
  • Tables from national statistics offices and ministries (24 newly fetched datasets) and tables already in the warehouse (e-Stat, OpenDOSM, National Statistical Office of Thailand, Brunei DEPS, Pakistan Bureau of Statistics, OCHA common datasets, OECD regional database, Pacific Community)
  • UN SDG (UN)
  • UN World Population Prospects 2024 (CC BY 3.0 IGO)
  • Calculated
Go to this country’s CSV

Palau PLW

National figures

IndicatorValueYearSource
Population17,614 people2026UN World Population Prospects 2024
People aged 15–344,397 people2026UN World Population Prospects 2024
Median age38.88 years old2026UN World Population Prospects 2024
Share of people living in cities79.28 %2025World Bank WDI
Household consumption per 1 person (price-adjusted)13,650 International dollars2024Calculated
GDP per 1 person (price-adjusted)23,052 International dollars2025World Bank WDI
Total household consumption (price-adjusted)241.54 million International dollars2024World Bank WDI
Inflation (1 year)-0.42 %2025World Bank WDI
Economic growth (1 year)6.29 %2025World Bank WDI
Share of people using the internet83.9 %2024UN SDG
International visitors72,000 people2025Asian Development Bank KIDB
Unemployment rate2.09 %2023ILO

Culture

Religion (2005, UNdata UN Demographic Yearbook: population by religion (census)): Catholic 49.4%, Protestant 23.2%, Modekngei (Palauan religion) 8.7%, Other 8.1%, Seventh-day Adventist 5.3%

Languages (2005, UNdata UN Demographic Yearbook: population by language (census)): Palauan 66.6%, English 15.5%, Filipino 10.8%, Chinese 1.8%, Other languages 1.3%

Source

The figures on this page come from the following public statistics. On the 3D map, click a number to see, for each one, the URL of the original file, the location inside it, the text exactly as written, the date fetched, the file fingerprint (sha256), and for calculated numbers, the formula and inputs.

  • ILO (CC BY 4.0)
  • UNdata UN Demographic Yearbook: population by religion (census) (terms_attribution)
  • UNdata UN Demographic Yearbook: population by language (census) (terms_attribution)
  • Asian Development Bank KIDB (CC BY 3.0 IGO)
  • World Bank WDI (CC BY 4.0)
  • UN SDG (UN)
  • UN World Population Prospects 2024 (CC BY 3.0 IGO)
  • Calculated
Go to this country’s CSV

Nauru NRU

National figures

IndicatorValueYearSource
Population12,101 people2026UN World Population Prospects 2024
People aged 15–343,946 people2026UN World Population Prospects 2024
Median age20.22 years old2026UN World Population Prospects 2024
Share of people living in cities100.0 %2025World Bank WDI
GDP per 1 person (price-adjusted)14,200 International dollars2025World Bank WDI
Inflation (1 year)4.26 %2023Asian Development Bank KIDB
Economic growth (1 year)2.14 %2025World Bank WDI
Share of people using the internet83 %2024UN SDG
Income inequality (Gini coefficient)32.4 2012World Bank WDI
Unemployment rate1 %2025Asian Development Bank KIDB

Figures by state/province (14 states/provinces)

Sorted by population. “―” means there is no figure, or the figure is not published here because its terms of use are unclear.

states/provincesPopulation
people · 2011
Population per 1km² (population density)
people/km² · 2011
Denigomodu1,8792,088
Meneng District1,380445.2
Aiwo District1,2201,109
Boe851.01,702
Yaren District747.0498.0
Buada Lagoon739.0284.2
Anibare District587.0189.4
Baiti513.0427.5
Anetan District452.0452.0
Ewa446.0371.7
Nibok409.0255.6
Uaboe318.0397.5
Ijuw District226.0205.5
Anabar District178.0118.7

Source

The figures on this page come from the following public statistics. On the 3D map, click a number to see, for each one, the URL of the original file, the location inside it, the text exactly as written, the date fetched, the file fingerprint (sha256), and for calculated numbers, the formula and inputs.

  • Pacific Community (SPC) Pacific Data Hub .Stat (CC BY 4.0)
  • Asian Development Bank KIDB (CC BY 3.0 IGO)
  • World Bank WDI (CC BY 4.0)
  • UN SDG (UN)
  • UN World Population Prospects 2024 (CC BY 3.0 IGO)
Go to this country’s CSV

Tuvalu TUV

National figures

IndicatorValueYearSource
Population9,362 people2026UN World Population Prospects 2024
People aged 15–342,856 people2026UN World Population Prospects 2024
Median age24.13 years old2026UN World Population Prospects 2024
Share of people living in cities65.45 %2025World Bank WDI
GDP per 1 person (price-adjusted)6,759 International dollars2025World Bank WDI
Inflation (1 year)2.92 %2025Asian Development Bank KIDB
Economic growth (1 year)1.64 %2025World Bank WDI
Share of people using the internet35.2 %2017UN SDG
International visitors3,000 people2023Asian Development Bank KIDB
Income inequality (Gini coefficient)39.1 2010World Bank WDI
Unemployment rate7.32 %2022ILO

Figures by state/province (8 states/provinces)

Sorted by population. “―” means there is no figure, or the figure is not published here because its terms of use are unclear.

states/provincesPopulation
people · 2017
Population per 1km² (population density)
people/km² · 2017
Funafuti Lagoon Hotel6,7162,634
Vaitupu1,195236.6
Nukufetau537.0165.2
Nanumea507.0152.7
Niutao501.0216.9
Nui501.0150.9
Nanumanga385.0132.3
Nukulaelae260.0128.7

Culture

Religion (2017, UNdata UN Demographic Yearbook: population by religion (census)): Church of Tuvalu (Ekalesia Kelisiano Tuvalu) 85.9%, Christian: Brethren Assembly 2.8%, Other 2.6%, Seventh-day Adventist 2.5%, Baha'i Faith 1.5%

Source

The figures on this page come from the following public statistics. On the 3D map, click a number to see, for each one, the URL of the original file, the location inside it, the text exactly as written, the date fetched, the file fingerprint (sha256), and for calculated numbers, the formula and inputs.

  • ILO (CC BY 4.0)
  • Pacific Community (SPC) Pacific Data Hub .Stat (CC BY 4.0)
  • UNdata UN Demographic Yearbook: population by religion (census) (terms_attribution)
  • Asian Development Bank KIDB (CC BY 3.0 IGO)
  • World Bank WDI (CC BY 4.0)
  • UN SDG (UN)
  • UN World Population Prospects 2024 (CC BY 3.0 IGO)
Go to this country’s CSV
04

Rankings

Rankings

Coverage varies by indicator; rankings do not always cover all 46 countries and territories.

The latest year differs by country. Future population figures are published projections from the UN or other sources, not forecasts made by this website.

Population billion people

1.482026
1.412026
0.287892026
0.25932026
0.177822026
0.122432026
0.117722026
0.102182026
0.071562026
0.055182026
0.05162026
0.036392026
0.029632026
0.027232026
0.026632026
0.023352026
0.023012026
0.018052026
0.010952026
0.007972026
0.007382026
0.005912026
0.005292026
0.003562026
0.001442026
0.0009372822026
0.0008582882026
0.0008022142026
0.0007231882026
0.0005315172026
0.0004697752026
0.0003425642026
0.0001384452026
0.0001141822026
0.0000350752026
0.0000176142026
0.0000121012026
0.0000093622026

Population ranking

38 Asia-Pacific countries and territories ranked by population (latest-year estimate), highest first. The top three are India, China, Indonesia. Each number has its source (public statistics from the UN, the World Bank and others) and year.

RankCountry/territoryPopulationYearSource
1India1.48 billion people2026UN World Population Prospects 2024
2China1.41 billion people2026UN World Population Prospects 2024
3Indonesia287.89 million people2026UN World Population Prospects 2024
4Pakistan259.30 million people2026UN World Population Prospects 2024
5Bangladesh177.82 million people2026UN World Population Prospects 2024
6Japan122.43 million people2026UN World Population Prospects 2024
7Philippines117.72 million people2026UN World Population Prospects 2024
8Vietnam102.18 million people2026UN World Population Prospects 2024
9Thailand71.56 million people2026UN World Population Prospects 2024
10Myanmar55.18 million people2026UN World Population Prospects 2024
11South Korea51.60 million people2026UN World Population Prospects 2024
12Malaysia36.39 million people2026UN World Population Prospects 2024
13Nepal29.63 million people2026UN World Population Prospects 2024
14Australia27.23 million people2026UN World Population Prospects 2024
15North Korea26.63 million people2026UN World Population Prospects 2024
16Sri Lanka23.35 million people2026UN World Population Prospects 2024
17Taiwan23.01 million people2026UN World Population Prospects 2024
18Cambodia18.05 million people2026UN World Population Prospects 2024
19Papua New Guinea10.95 million people2026UN World Population Prospects 2024
20Laos7.97 million people2026UN World Population Prospects 2024
21Hong Kong7.38 million people2026UN World Population Prospects 2024
22Singapore5.91 million people2026UN World Population Prospects 2024
23New Zealand5.29 million people2026UN World Population Prospects 2024
24Mongolia3.56 million people2026UN World Population Prospects 2024
25Timor-Leste1.44 million people2026UN World Population Prospects 2024
26Fiji937,282 people2026UN World Population Prospects 2024
27Solomon Islands858,288 people2026UN World Population Prospects 2024
28Bhutan802,214 people2026UN World Population Prospects 2024
29Macau723,188 people2026UN World Population Prospects 2024
30Maldives531,517 people2026UN World Population Prospects 2024
31Brunei469,775 people2026UN World Population Prospects 2024
32Vanuatu342,564 people2026UN World Population Prospects 2024
33Kiribati138,445 people2026UN World Population Prospects 2024
34Federated States of Micronesia114,182 people2026UN World Population Prospects 2024
35Marshall Islands35,075 people2026UN World Population Prospects 2024
36Palau17,614 people2026UN World Population Prospects 2024
37Nauru12,101 people2026UN World Population Prospects 2024
38Tuvalu9,362 people2026UN World Population Prospects 2024

Compare with care: forecast (estimate)

Source

  • UN World Population Prospects 2024 (CC BY 3.0 IGO)

On the 3D map, click a number to see the URL of the original file, the location inside it, the text exactly as written, the date fetched and the file fingerprint (sha256).

Population density ranking

38 Asia-Pacific countries and territories ranked by population per km², highest first. The top three are Macau, Singapore, Hong Kong. Each number has its source (public statistics from the UN, the World Bank and others) and year.

RankCountry/territoryPopulation per 1km² (population density)YearSource
1Macau21,915 people/km²2026Population (UN, World Bank) ÷ country area (World Bank WDI)
2Singapore8,225 people/km²2026Population (UN, World Bank) ÷ country area (World Bank WDI)
3Hong Kong7,027 people/km²2026Population (UN, World Bank) ÷ country area (World Bank WDI)
4Maldives1,784 people/km²2026Population (UN, World Bank) ÷ country area (World Bank WDI)
5Bangladesh1,368 people/km²2026Population (UN, World Bank) ÷ country area (World Bank WDI)
6Taiwan635.7 people/km²2026Population (UN, World Bank) ÷ country area (World Bank WDI)
7Nauru605.0 people/km²2026Population (UN, World Bank) ÷ country area (World Bank WDI)
8South Korea528.7 people/km²2026Population (UN, World Bank) ÷ country area (World Bank WDI)
9India496.6 people/km²2026Population (UN, World Bank) ÷ country area (World Bank WDI)
10Philippines394.8 people/km²2026Population (UN, World Bank) ÷ country area (World Bank WDI)
11Sri Lanka377.4 people/km²2026Population (UN, World Bank) ÷ country area (World Bank WDI)
12Pakistan336.4 people/km²2026Population (UN, World Bank) ÷ country area (World Bank WDI)
13Japan335.8 people/km²2026Population (UN, World Bank) ÷ country area (World Bank WDI)
14Vietnam326.0 people/km²2026Population (UN, World Bank) ÷ country area (World Bank WDI)
15Tuvalu312.1 people/km²2026Population (UN, World Bank) ÷ country area (World Bank WDI)
16North Korea221.2 people/km²2026Population (UN, World Bank) ÷ country area (World Bank WDI)
17Nepal206.7 people/km²2026Population (UN, World Bank) ÷ country area (World Bank WDI)
18Marshall Islands194.9 people/km²2026Population (UN, World Bank) ÷ country area (World Bank WDI)
19Kiribati170.9 people/km²2026Population (UN, World Bank) ÷ country area (World Bank WDI)
20Federated States of Micronesia163.1 people/km²2026Population (UN, World Bank) ÷ country area (World Bank WDI)
21Indonesia152.1 people/km²2026Population (UN, World Bank) ÷ country area (World Bank WDI)
22China150.5 people/km²2026Population (UN, World Bank) ÷ country area (World Bank WDI)
23Thailand140.1 people/km²2026Population (UN, World Bank) ÷ country area (World Bank WDI)
24Malaysia110.7 people/km²2026Population (UN, World Bank) ÷ country area (World Bank WDI)
25Cambodia102.3 people/km²2026Population (UN, World Bank) ÷ country area (World Bank WDI)
26Timor-Leste96.6 people/km²2026Population (UN, World Bank) ÷ country area (World Bank WDI)
27Brunei89.1 people/km²2026Population (UN, World Bank) ÷ country area (World Bank WDI)
28Myanmar84.6 people/km²2026Population (UN, World Bank) ÷ country area (World Bank WDI)
29Fiji51.3 people/km²2026Population (UN, World Bank) ÷ country area (World Bank WDI)
30Palau38.3 people/km²2026Population (UN, World Bank) ÷ country area (World Bank WDI)
31Laos34.5 people/km²2026Population (UN, World Bank) ÷ country area (World Bank WDI)
32Solomon Islands30.7 people/km²2026Population (UN, World Bank) ÷ country area (World Bank WDI)
33Vanuatu28.1 people/km²2026Population (UN, World Bank) ÷ country area (World Bank WDI)
34Papua New Guinea24.2 people/km²2026Population (UN, World Bank) ÷ country area (World Bank WDI)
35Bhutan21 people/km²2026Population (UN, World Bank) ÷ country area (World Bank WDI)
36New Zealand20.1 people/km²2026Population (UN, World Bank) ÷ country area (World Bank WDI)
37Australia3.5 people/km²2026Population (UN, World Bank) ÷ country area (World Bank WDI)
38Mongolia2.3 people/km²2026Population (UN, World Bank) ÷ country area (World Bank WDI)

Source

  • Population (UN, World Bank) ÷ country area (World Bank WDI)

On the 3D map, click a number to see the URL of the original file, the location inside it, the text exactly as written, the date fetched and the file fingerprint (sha256).

Area ranking

38 Asia-Pacific countries and territories ranked by land area, highest first. The top three are China, Australia, India. Each number has its source (public statistics from the UN, the World Bank and others) and year.

RankCountry/territoryLand area of the countryYearSource
1China9.39 million km²2023Tables from national statistics offices and governments
2Australia7.69 million km²2023Tables from national statistics offices and governments
3India2.97 million km²2023Tables from national statistics offices and governments
4Indonesia1.89 million km²2023Tables from national statistics offices and governments
5Mongolia1.56 million km²2023Tables from national statistics offices and governments
6Pakistan770,880 km²2023Tables from national statistics offices and governments
7Myanmar652,670 km²2023Tables from national statistics offices and governments
8Thailand510,890 km²2023Tables from national statistics offices and governments
9Papua New Guinea452,860 km²2023Tables from national statistics offices and governments
10Japan364,569 km²2023Tables from national statistics offices and governments
11Malaysia328,550 km²2023Tables from national statistics offices and governments
12Vietnam313,429 km²2023Tables from national statistics offices and governments
13Philippines298,170 km²2023Tables from national statistics offices and governments
14New Zealand263,310 km²2023Tables from national statistics offices and governments
15Laos230,800 km²2023Tables from national statistics offices and governments
16Cambodia176,520 km²2023Tables from national statistics offices and governments
17Nepal143,350 km²2023Tables from national statistics offices and governments
18Bangladesh129,980 km²2023Tables from national statistics offices and governments
19North Korea120,410 km²2023Tables from national statistics offices and governments
20South Korea97,600 km²2023Tables from national statistics offices and governments
21Sri Lanka61,860 km²2023Tables from national statistics offices and governments
22Bhutan38,140 km²2023Tables from national statistics offices and governments
23Taiwan36,197 km²2025Tables from national statistics offices and governments
24Solomon Islands27,990 km²2023Tables from national statistics offices and governments
25Fiji18,270 km²2023Tables from national statistics offices and governments
26Timor-Leste14,870 km²2023Tables from national statistics offices and governments
27Vanuatu12,190 km²2023Tables from national statistics offices and governments
28Brunei5,270 km²2023Tables from national statistics offices and governments
29Hong Kong1,050 km²2023Tables from national statistics offices and governments
30Kiribati810.0 km²2023Tables from national statistics offices and governments
31Singapore718.0 km²2023Tables from national statistics offices and governments
32Federated States of Micronesia700.0 km²2023Tables from national statistics offices and governments
33Palau460.0 km²2023Tables from national statistics offices and governments
34Maldives298.0 km²2023Tables from national statistics offices and governments
35Marshall Islands180.0 km²2023Tables from national statistics offices and governments
36Macau33 km²2023Tables from national statistics offices and governments
37Tuvalu30 km²2023Tables from national statistics offices and governments
38Nauru20 km²2023Tables from national statistics offices and governments

The latest year available differs by country (2023–2025). Check the Year column.

Source

  • Tables from national statistics offices and governments (Geospatial Information Authority of Japan; Forest Survey of India and the governments of Jammu and Kashmir / Ladakh; Urban Redevelopment Authority of Singapore; Department of Statistics Malaysia; Office of Agricultural Economics of Thailand (Royal Thai Survey Department values); Ministry of Home Affairs of Indonesia; General Statistics Office of Vietnam; Philippine Statistics Authority; Ministry of Civil Affairs of China; Census and Statistics Department / Lands Department of Hong Kong; Ministry of the Interior of Taiwan; Ministry of Land, Infrastructure and Transport of Korea; Statistics Korea (North Korea); National Statistics Office of Mongolia; Department of Economic Planning and Statistics of Brunei; National Institute of Statistics of Cambodia; Lao Statistics Bureau; Department of Population of Myanmar and MIMU; Bangladesh Bureau of Statistics; National Statistics Bureau of Bhutan; National Statistics Office of Nepal; Pakistan Bureau of Statistics and the governments of AJK and GB; Department of Census and Statistics of Sri Lanka; Australian Bureau of Statistics; Stats NZ; statistics offices of Fiji / Solomon Islands / Vanuatu / Kiribati / Micronesia / Marshall Islands / Palau / Tuvalu, etc.) + areas from OCHA COD-AB tables (measured from boundary shapes; only where no official table exists) + Wikidata (Nauru only) + World Bank WDI (country rows). The OECD regional database is used for cross-checking

On the 3D map, click a number to see the URL of the original file, the location inside it, the text exactly as written, the date fetched and the file fingerprint (sha256).

Aging rate ranking

38 Asia-Pacific countries and territories ranked by share of people aged 65+, highest first. The top three are Japan, Hong Kong, South Korea. Each number has its source (public statistics from the UN, the World Bank and others) and year.

RankCountry/territoryShare aged 65+YearSource
1Japan30.2 %2026UN World Population Prospects 2024
2Hong Kong24.68 %2026UN World Population Prospects 2024
3South Korea21.43 %2026UN World Population Prospects 2024
4Taiwan20.94 %2026UN World Population Prospects 2024
5Australia18.47 %2026UN World Population Prospects 2024
6New Zealand18.04 %2026UN World Population Prospects 2024
7Thailand16.68 %2026UN World Population Prospects 2024
8Macau15.93 %2026UN World Population Prospects 2024
9China15.13 %2026UN World Population Prospects 2024
10Singapore14.76 %2026UN World Population Prospects 2024
11North Korea13.01 %2026UN World Population Prospects 2024
12Sri Lanka12.84 %2026UN World Population Prospects 2024
13Palau12.35 %2026UN World Population Prospects 2024
14Vietnam9.91 %2026UN World Population Prospects 2024
15Malaysia8.34 %2026UN World Population Prospects 2024
16Indonesia7.81 %2026UN World Population Prospects 2024
17Myanmar7.74 %2026UN World Population Prospects 2024
18Brunei7.62 %2026UN World Population Prospects 2024
19India7.61 %2026UN World Population Prospects 2024
20Tuvalu7.51 %2026UN World Population Prospects 2024
21Bangladesh6.84 %2026UN World Population Prospects 2024
22Fiji6.79 %2026UN World Population Prospects 2024
23Bhutan6.77 %2026UN World Population Prospects 2024
24Nepal6.74 %2026UN World Population Prospects 2024
25Cambodia6.6 %2026UN World Population Prospects 2024
26Federated States of Micronesia6.37 %2026UN World Population Prospects 2024
27Philippines5.95 %2026UN World Population Prospects 2024
28Mongolia5.74 %2026UN World Population Prospects 2024
29Maldives5.29 %2026UN World Population Prospects 2024
30Timor-Leste5.19 %2026UN World Population Prospects 2024
31Marshall Islands5.13 %2026UN World Population Prospects 2024
32Laos4.96 %2026UN World Population Prospects 2024
33Kiribati4.54 %2026UN World Population Prospects 2024
34Vanuatu4.46 %2026UN World Population Prospects 2024
35Pakistan4.44 %2026UN World Population Prospects 2024
36Papua New Guinea3.72 %2026UN World Population Prospects 2024
37Solomon Islands3.71 %2026UN World Population Prospects 2024
38Nauru3.17 %2026UN World Population Prospects 2024

Compare with care: forecast (estimate)

Source

  • UN World Population Prospects 2024 (CC BY 3.0 IGO)

On the 3D map, click a number to see the URL of the original file, the location inside it, the text exactly as written, the date fetched and the file fingerprint (sha256).

Share of children ranking

38 Asia-Pacific countries and territories ranked by share of people aged 0–14, highest first. The top three are Vanuatu, Nauru, Solomon Islands. Each number has its source (public statistics from the UN, the World Bank and others) and year.

RankCountry/territoryShare of childrenYearSource
1Vanuatu37.57 %2026UN World Population Prospects 2024
2Nauru36.45 %2026UN World Population Prospects 2024
3Solomon Islands36.12 %2026UN World Population Prospects 2024
4Pakistan35.79 %2026UN World Population Prospects 2024
5Kiribati33.96 %2026UN World Population Prospects 2024
6Marshall Islands33.25 %2026UN World Population Prospects 2024
7Tuvalu32.94 %2026UN World Population Prospects 2024
8Papua New Guinea32.8 %2026UN World Population Prospects 2024
9Timor-Leste32.61 %2026UN World Population Prospects 2024
10Federated States of Micronesia31.16 %2026UN World Population Prospects 2024
11Mongolia30.87 %2026UN World Population Prospects 2024
12Laos29.48 %2026UN World Population Prospects 2024
13Cambodia29.21 %2026UN World Population Prospects 2024
14Nepal27.67 %2026UN World Population Prospects 2024
15Bangladesh27.33 %2026UN World Population Prospects 2024
16Fiji26.57 %2026UN World Population Prospects 2024
17Philippines26.41 %2026UN World Population Prospects 2024
18Indonesia23.87 %2026UN World Population Prospects 2024
19Myanmar23.86 %2026UN World Population Prospects 2024
20India23.79 %2026UN World Population Prospects 2024
21Vietnam22.44 %2026UN World Population Prospects 2024
22Sri Lanka21.39 %2026UN World Population Prospects 2024
23Malaysia20.85 %2026UN World Population Prospects 2024
24Brunei20.39 %2026UN World Population Prospects 2024
25Bhutan19.81 %2026UN World Population Prospects 2024
26North Korea18.89 %2026UN World Population Prospects 2024
27Maldives18.43 %2026UN World Population Prospects 2024
28New Zealand17.64 %2026UN World Population Prospects 2024
29Palau17.61 %2026UN World Population Prospects 2024
30Australia17.52 %2026UN World Population Prospects 2024
31China14.8 %2026UN World Population Prospects 2024
32Thailand14.08 %2026UN World Population Prospects 2024
33Macau13.43 %2026UN World Population Prospects 2024
34Singapore11.75 %2026UN World Population Prospects 2024
35Taiwan11.28 %2026UN World Population Prospects 2024
36Japan11.05 %2026UN World Population Prospects 2024
37Hong Kong10.02 %2026UN World Population Prospects 2024
38South Korea9.82 %2026UN World Population Prospects 2024

Compare with care: forecast (estimate)

Source

  • UN World Population Prospects 2024 (CC BY 3.0 IGO)

On the 3D map, click a number to see the URL of the original file, the location inside it, the text exactly as written, the date fetched and the file fingerprint (sha256).

Median age ranking

38 Asia-Pacific countries and territories ranked by median age (the middle age when everyone is lined up by age), highest first. The top three are Japan, Hong Kong, South Korea. Each number has its source (public statistics from the UN, the World Bank and others) and year.

RankCountry/territoryMedian ageYearSource
1Japan50.18 years old2026UN World Population Prospects 2024
2Hong Kong47.95 years old2026UN World Population Prospects 2024
3South Korea46.19 years old2026UN World Population Prospects 2024
4Taiwan45.41 years old2026UN World Population Prospects 2024
5Thailand40.98 years old2026UN World Population Prospects 2024
6China40.65 years old2026UN World Population Prospects 2024
7Macau40.27 years old2026UN World Population Prospects 2024
8Palau38.88 years old2026UN World Population Prospects 2024
9Australia38.52 years old2026UN World Population Prospects 2024
10New Zealand37.99 years old2026UN World Population Prospects 2024
11North Korea36.8 years old2026UN World Population Prospects 2024
12Singapore36.77 years old2026UN World Population Prospects 2024
13Vietnam33.9 years old2026UN World Population Prospects 2024
14Sri Lanka33.62 years old2026UN World Population Prospects 2024
15Maldives33.43 years old2026UN World Population Prospects 2024
16Brunei33.18 years old2026UN World Population Prospects 2024
17Malaysia31.38 years old2026UN World Population Prospects 2024
18Bhutan30.99 years old2026UN World Population Prospects 2024
19Indonesia30.66 years old2026UN World Population Prospects 2024
20Myanmar30.41 years old2026UN World Population Prospects 2024
21India29.22 years old2026UN World Population Prospects 2024
22Fiji28.27 years old2026UN World Population Prospects 2024
23Mongolia26.97 years old2026UN World Population Prospects 2024
24Philippines26.57 years old2026UN World Population Prospects 2024
25Cambodia26.37 years old2026UN World Population Prospects 2024
26Bangladesh26.3 years old2026UN World Population Prospects 2024
27Nepal25.7 years old2026UN World Population Prospects 2024
28Laos25.28 years old2026UN World Population Prospects 2024
29Tuvalu24.13 years old2026UN World Population Prospects 2024
30Federated States of Micronesia23.49 years old2026UN World Population Prospects 2024
31Kiribati23.02 years old2026UN World Population Prospects 2024
32Papua New Guinea23.01 years old2026UN World Population Prospects 2024
33Timor-Leste22.09 years old2026UN World Population Prospects 2024
34Solomon Islands20.92 years old2026UN World Population Prospects 2024
35Pakistan20.77 years old2026UN World Population Prospects 2024
36Marshall Islands20.48 years old2026UN World Population Prospects 2024
37Vanuatu20.35 years old2026UN World Population Prospects 2024
38Nauru20.22 years old2026UN World Population Prospects 2024

Compare with care: forecast (estimate)

Source

  • UN World Population Prospects 2024 (CC BY 3.0 IGO)

On the 3D map, click a number to see the URL of the original file, the location inside it, the text exactly as written, the date fetched and the file fingerprint (sha256).

Population growth ranking

38 Asia-Pacific countries and territories ranked by population growth over one year, highest first. The top three are Solomon Islands, Vanuatu, Papua New Guinea. Each number has its source (public statistics from the UN, the World Bank and others) and year.

RankCountry/territoryPopulation growth (1-year)YearSource
1Solomon Islands2.3 %2026UN World Population Prospects 2024
2Vanuatu2.16 %2026UN World Population Prospects 2024
3Papua New Guinea1.68 %2026UN World Population Prospects 2024
4Pakistan1.59 %2026UN World Population Prospects 2024
5Kiribati1.41 %2026UN World Population Prospects 2024
6Timor-Leste1.31 %2026UN World Population Prospects 2024
7Laos1.25 %2026UN World Population Prospects 2024
8Bangladesh1.19 %2026UN World Population Prospects 2024
9Cambodia1.1 %2026UN World Population Prospects 2024
10Malaysia1.1 %2026UN World Population Prospects 2024
11Mongolia1.09 %2026UN World Population Prospects 2024
12Australia0.91 %2026UN World Population Prospects 2024
13India0.86 %2026UN World Population Prospects 2024
14Philippines0.79 %2026UN World Population Prospects 2024
15Indonesia0.74 %2026UN World Population Prospects 2024
16Brunei0.72 %2026UN World Population Prospects 2024
17Bhutan0.7 %2026UN World Population Prospects 2024
18New Zealand0.65 %2026UN World Population Prospects 2024
19Nauru0.64 %2026UN World Population Prospects 2024
20Myanmar0.59 %2026UN World Population Prospects 2024
21Singapore0.56 %2026UN World Population Prospects 2024
22Vietnam0.55 %2026UN World Population Prospects 2024
23Sri Lanka0.5 %2026UN World Population Prospects 2024
24Federated States of Micronesia0.43 %2026UN World Population Prospects 2024
25Fiji0.43 %2026UN World Population Prospects 2024
26Maldives0.35 %2026UN World Population Prospects 2024
27Macau0.23 %2026UN World Population Prospects 2024
28North Korea0.22 %2026UN World Population Prospects 2024
29Nepal0.14 %2026UN World Population Prospects 2024
30Thailand-0.09 %2026UN World Population Prospects 2024
31South Korea-0.14 %2026UN World Population Prospects 2024
32China-0.22 %2026UN World Population Prospects 2024
33Palau-0.3 %2026UN World Population Prospects 2024
34Taiwan-0.44 %2026UN World Population Prospects 2024
35Hong Kong-0.46 %2026UN World Population Prospects 2024
36Japan-0.56 %2026UN World Population Prospects 2024
37Tuvalu-1.24 %2026UN World Population Prospects 2024
38Marshall Islands-3.28 %2026UN World Population Prospects 2024

Compare with care: forecast (estimate)

Source

  • UN World Population Prospects 2024 (CC BY 3.0 IGO)

On the 3D map, click a number to see the URL of the original file, the location inside it, the text exactly as written, the date fetched and the file fingerprint (sha256).

Urban population ranking

38 Asia-Pacific countries and territories ranked by share of people living in cities, highest first. The top three are Hong Kong, Nauru, Singapore. Each number has its source (public statistics from the UN, the World Bank and others) and year.

RankCountry/territoryShare of people living in citiesYearSource
1Hong Kong100.0 %2025World Bank WDI
2Nauru100.0 %2025World Bank WDI
3Singapore100.0 %2025World Bank WDI
4Macau100.0 %2025World Bank WDI
5Japan92.3 %2025World Bank WDI
6Australia87.72 %2025World Bank WDI
7New Zealand84 %2025World Bank WDI
8South Korea81.17 %2025World Bank WDI
9Palau79.28 %2025World Bank WDI
10Marshall Islands79.11 %2025World Bank WDI
11Malaysia77.39 %2025World Bank WDI
12Brunei75.01 %2025World Bank WDI
13Mongolia71.14 %2025World Bank WDI
14Nepal67 %2025World Bank WDI
15China66.34 %2025World Bank WDI
16Tuvalu65.45 %2025World Bank WDI
17North Korea64.19 %2025World Bank WDI
18Kiribati63.38 %2025World Bank WDI
19Thailand62.8 %2025World Bank WDI
20Taiwan62 %2025Asian Development Bank KIDB
21Fiji59.54 %2025World Bank WDI
22Indonesia59.39 %2025World Bank WDI
23Philippines55.77 %2025World Bank WDI
24Bhutan43.43 %2025World Bank WDI
25Maldives42.51 %2025World Bank WDI
26Cambodia41.11 %2025World Bank WDI
27Laos40.31 %2025World Bank WDI
28Pakistan39.53 %2025World Bank WDI
29Vietnam38.83 %2025World Bank WDI
30India35.69 %2025World Bank WDI
31Bangladesh33.24 %2025World Bank WDI
32Solomon Islands31.31 %2025World Bank WDI
33Myanmar30.58 %2025World Bank WDI
34Timor-Leste28.79 %2025World Bank WDI
35Federated States of Micronesia22.48 %2025World Bank WDI
36Vanuatu22.32 %2025World Bank WDI
37Sri Lanka20.45 %2025World Bank WDI
38Papua New Guinea15.78 %2025World Bank WDI

Compare with care: sources differ by country (Asian Development Bank KIDB, World Bank WDI)

Source

  • Asian Development Bank KIDB (CC BY 3.0 IGO)
  • World Bank WDI (CC BY 4.0)

On the 3D map, click a number to see the URL of the original file, the location inside it, the text exactly as written, the date fetched and the file fingerprint (sha256).

GDP ranking

36 Asia-Pacific countries and territories ranked by size of the economy (GDP, US$), highest first. The top three are China, Japan, India. Each number has its source (public statistics from the UN, the World Bank and others) and year.

RankCountry/territorySize of the economy (GDP, US dollars)YearSource
1China19.50 trillion US dollars2025World Bank WDI
2Japan4.44 trillion US dollars2025World Bank WDI
3India3.96 trillion US dollars2025World Bank WDI
4South Korea1.87 trillion US dollars2025World Bank WDI
5Australia1.80 trillion US dollars2025World Bank WDI
6Indonesia1.45 trillion US dollars2025World Bank WDI
7Singapore603.87 billion US dollars2025World Bank WDI
8Thailand577.01 billion US dollars2025World Bank WDI
9Vietnam514.70 billion US dollars2025World Bank WDI
10Philippines487.09 billion US dollars2025World Bank WDI
11Malaysia472.19 billion US dollars2025World Bank WDI
12Bangladesh456.32 billion US dollars2025World Bank WDI
13Hong Kong427.31 billion US dollars2025World Bank WDI
14Pakistan407.31 billion US dollars2025World Bank WDI
15New Zealand264.06 billion US dollars2025World Bank WDI
16Sri Lanka108.83 billion US dollars2025World Bank WDI
17Myanmar81.67 billion US dollars2025World Bank WDI
18Macau52.06 billion US dollars2025World Bank WDI
19Cambodia51.27 billion US dollars2025World Bank WDI
20Nepal45.49 billion US dollars2025World Bank WDI
21Papua New Guinea32.50 billion US dollars2025World Bank WDI
22Mongolia25.37 billion US dollars2025World Bank WDI
23Laos18.30 billion US dollars2025World Bank WDI
24Brunei15.03 billion US dollars2025World Bank WDI
25Maldives7.74 billion US dollars2025World Bank WDI
26Fiji6.20 billion US dollars2025World Bank WDI
27Bhutan3.58 billion US dollars2025World Bank WDI
28Timor-Leste1.90 billion US dollars2025World Bank WDI
29Solomon Islands1.75 billion US dollars2025World Bank WDI
30Vanuatu1.35 billion US dollars2025World Bank WDI
31Federated States of Micronesia501.80 million US dollars2025World Bank WDI
32Kiribati349.23 million US dollars2025World Bank WDI
33Palau345.00 million US dollars2025World Bank WDI
34Marshall Islands308.00 million US dollars2025World Bank WDI
35Nauru176.04 million US dollars2025World Bank WDI
36Tuvalu57.35 million US dollars2025World Bank WDI

Source

  • World Bank WDI (CC BY 4.0)

On the 3D map, click a number to see the URL of the original file, the location inside it, the text exactly as written, the date fetched and the file fingerprint (sha256).

GDP per capita ranking

37 Asia-Pacific countries and territories ranked by GDP per capita (PPP, international dollars), highest first. The top three are Singapore, Macau, Brunei. Each number has its source (public statistics from the UN, the World Bank and others) and year.

RankCountry/territoryGDP per 1 person (price-adjusted)YearSource
1Singapore163,354 International dollars2025World Bank WDI
2Macau137,031 International dollars2025World Bank WDI
3Brunei92,430 International dollars2025World Bank WDI
4Taiwan90,018 International dollars2025Asian Development Bank KIDB
5Hong Kong80,423 International dollars2025World Bank WDI
6Australia71,934 International dollars2025World Bank WDI
7South Korea63,125 International dollars2025World Bank WDI
8New Zealand57,350 International dollars2025World Bank WDI
9Japan55,422 International dollars2025World Bank WDI
10Malaysia41,498 International dollars2025World Bank WDI
11China29,333 International dollars2025World Bank WDI
12Maldives28,555 International dollars2025World Bank WDI
13Thailand26,250 International dollars2025World Bank WDI
14Palau23,052 International dollars2025World Bank WDI
15Mongolia20,798 International dollars2025World Bank WDI
16Bhutan19,594 International dollars2025World Bank WDI
17Vietnam18,088 International dollars2025World Bank WDI
18Indonesia17,660 International dollars2025World Bank WDI
19Sri Lanka17,065 International dollars2025World Bank WDI
20Fiji16,338 International dollars2025World Bank WDI
21Nauru14,200 International dollars2025World Bank WDI
22Philippines12,577 International dollars2025World Bank WDI
23India11,748 International dollars2025World Bank WDI
24Laos10,383 International dollars2025World Bank WDI
25Bangladesh10,154 International dollars2025World Bank WDI
26Marshall Islands8,964 International dollars2025World Bank WDI
27Cambodia8,543 International dollars2025World Bank WDI
28Tuvalu6,759 International dollars2025World Bank WDI
29Pakistan6,573 International dollars2025World Bank WDI
30Nepal6,175 International dollars2025World Bank WDI
31Myanmar6,012 International dollars2025World Bank WDI
32Papua New Guinea5,215 International dollars2025World Bank WDI
33Timor-Leste4,809 International dollars2025World Bank WDI
34Federated States of Micronesia4,604 International dollars2025World Bank WDI
35Vanuatu4,525 International dollars2025World Bank WDI
36Kiribati3,937 International dollars2025World Bank WDI
37Solomon Islands2,788 International dollars2025World Bank WDI

Compare with care: sources differ by country (Asian Development Bank KIDB, World Bank WDI)

Source

  • Asian Development Bank KIDB (CC BY 3.0 IGO)
  • World Bank WDI (CC BY 4.0)

On the 3D map, click a number to see the URL of the original file, the location inside it, the text exactly as written, the date fetched and the file fingerprint (sha256).

Income per capita ranking

37 Asia-Pacific countries and territories ranked by national income per person (GNI, US$), highest first. The top three are Singapore, Macau, Australia. Each number has its source (public statistics from the UN, the World Bank and others) and year.

RankCountry/territoryIncome per 1 person (GNI)YearSource
1Singapore81,760 US dollars2025World Bank WDI
2Macau69,920 US dollars2024World Bank WDI
3Australia64,120 US dollars2025World Bank WDI
4Hong Kong62,500 US dollars2025World Bank WDI
5New Zealand46,630 US dollars2025World Bank WDI
6Taiwan39,747 US dollars2025Asian Development Bank KIDB
7Japan38,340 US dollars2025World Bank WDI
8South Korea37,880 US dollars2025World Bank WDI
9Brunei34,790 US dollars2025World Bank WDI
10Nauru20,690 US dollars2025World Bank WDI
11Palau19,890 US dollars2025World Bank WDI
12China14,230 US dollars2025World Bank WDI
13Maldives12,950 US dollars2025World Bank WDI
14Malaysia12,380 US dollars2025World Bank WDI
15Tuvalu9,780 US dollars2025World Bank WDI
16Marshall Islands9,710 US dollars2025World Bank WDI
17Thailand7,690 US dollars2025World Bank WDI
18Fiji6,230 US dollars2025World Bank WDI
19Mongolia6,210 US dollars2025World Bank WDI
20Indonesia5,120 US dollars2025World Bank WDI
21Vietnam4,970 US dollars2025World Bank WDI
22Philippines4,850 US dollars2025World Bank WDI
23Federated States of Micronesia4,760 US dollars2025World Bank WDI
24Sri Lanka4,670 US dollars2025World Bank WDI
25Vanuatu4,410 US dollars2025World Bank WDI
26Bhutan4,310 US dollars2025World Bank WDI
27Kiribati3,930 US dollars2025World Bank WDI
28Papua New Guinea2,890 US dollars2025World Bank WDI
29Bangladesh2,840 US dollars2025World Bank WDI
30India2,760 US dollars2025World Bank WDI
31Cambodia2,750 US dollars2025World Bank WDI
32Laos2,150 US dollars2025World Bank WDI
33Solomon Islands2,020 US dollars2025World Bank WDI
34Nepal1,570 US dollars2025World Bank WDI
35Timor-Leste1,510 US dollars2025World Bank WDI
36Pakistan1,500 US dollars2025World Bank WDI
37Myanmar1,320 US dollars2025World Bank WDI

The latest year available differs by country (2024–2025). Check the Year column.

Compare with care: sources differ by country (Asian Development Bank KIDB, World Bank WDI)

Source

  • Asian Development Bank KIDB (CC BY 3.0 IGO)
  • World Bank WDI (CC BY 4.0)

On the 3D map, click a number to see the URL of the original file, the location inside it, the text exactly as written, the date fetched and the file fingerprint (sha256).

Household consumption per capita ranking

34 Asia-Pacific countries and territories ranked by household consumption per person (PPP, international dollars), highest first. The top three are Hong Kong, Singapore, Australia. Each number has its source (public statistics from the UN, the World Bank and others) and year.

RankCountry/territoryHousehold consumption per 1 person (price-adjusted)YearSource
1Hong Kong51,714 International dollars2025Calculated
2Singapore40,837 International dollars2025Calculated
3Australia36,475 International dollars2025Calculated
4Macau35,251 International dollars2025Calculated
5New Zealand31,468 International dollars2024Calculated
6South Korea28,126 International dollars2025Calculated
7Japan27,366 International dollars2024Calculated
8Taiwan26,340 International dollars2021World Bank ICP
9Malaysia24,224 International dollars2025Calculated
10Brunei23,443 International dollars2025Calculated
11Thailand14,602 International dollars2025Calculated
12Palau13,650 International dollars2024Calculated
13Sri Lanka11,727 International dollars2025Calculated
14Maldives11,279 International dollars2024Calculated
15Mongolia11,150 International dollars2025Calculated
16Fiji11,075 International dollars2024Calculated
17China10,692 International dollars2024Calculated
18Vietnam9,341 International dollars2025Calculated
19Bhutan9,116 International dollars2024Calculated
20Indonesia9,089 International dollars2025Calculated
21Philippines8,925 International dollars2025Calculated
22India6,741 International dollars2025Calculated
23Bangladesh6,488 International dollars2025Calculated
24Pakistan5,702 International dollars2025Calculated
25Nepal5,028 International dollars2025Calculated
26Cambodia4,560 International dollars2025Calculated
27Marshall Islands4,349 International dollars2021Calculated
28Kiribati4,294 International dollars2024Calculated
29Laos3,634 International dollars2021World Bank ICP
30Vanuatu2,844 International dollars2024Calculated
31Timor-Leste2,444 International dollars2024Calculated
32Myanmar2,271 International dollars2017World Bank ICP
33Solomon Islands1,762 International dollars2024Calculated
34Papua New Guinea873.7 International dollars2004Calculated

The latest year available differs by country (2004–2025). Check the Year column.

Compare with care: sources differ by country (World Bank ICP, calculated)

Source

  • World Bank ICP (CC BY 4.0)
  • Calculated

On the 3D map, click a number to see the URL of the original file, the location inside it, the text exactly as written, the date fetched and the file fingerprint (sha256).

Average monthly wage ranking

32 Asia-Pacific countries and territories ranked by average monthly earnings of employees (PPP, international dollars), highest first. The top three are South Korea, Singapore, New Zealand. Each number has its source (public statistics from the UN, the World Bank and others) and year.

RankCountry/territoryAverage monthly wage (price-adjusted)YearSource
1South Korea4,525 International dollars2022ILO SDMX (ILO,DF_EAR_EMTA_SEX_CUR_NB)
2Singapore4,420 International dollars2021ILO SDMX (ILO,DF_EAR_EMTA_SEX_CUR_NB)
3New Zealand4,064 International dollars2022ILO SDMX (ILO,DF_EAR_EMTA_SEX_CUR_NB)
4Australia3,926 International dollars2021ILO SDMX (ILO,DF_EAR_EMTA_SEX_CUR_NB)
5Solomon Islands2,823 International dollars2005ILO SDMX (ILO,DF_EAR_EMTA_SEX_CUR_NB)
6Japan2,809 International dollars2021ILO SDMX (ILO,DF_EAR_EMTA_SEX_CUR_NB)
7Macau2,645 International dollars2018ILO SDMX (ILO,DF_EAR_EMTA_SEX_CUR_NB)
8Brunei2,376 International dollars2014ILO SDMX (ILO,DF_EAR_EMTA_SEX_CUR_NB)
9Hong Kong2,324 International dollars2016ILO SDMX (ILO,DF_EAR_EMTA_SEX_CUR_NB)
10Malaysia1,866 International dollars2020ILO SDMX (ILO,DF_EAR_EMTA_SEX_CUR_NB)
11Mongolia1,683 International dollars2025ILO SDMX (ILO,DF_EAR_EMTA_SEX_CUR_NB)
12Thailand1,574 International dollars2025ILO SDMX (ILO,DF_EAR_EMTA_SEX_CUR_NB)
13Fiji1,503 International dollars2024ILO SDMX (ILO,DF_EAR_EMTA_SEX_CUR_NB)
14China1,435 International dollars2022ILO SDMX (ILO,DF_EAR_EMTA_SEX_CUR_NB)
15Bhutan1,333 International dollars2025ILO SDMX (ILO,DF_EAR_EMTA_SEX_CUR_NB)
16Vietnam1,198 International dollars2024ILO SDMX (ILO,DF_EAR_EMTA_SEX_CUR_NB)
17Maldives1,141 International dollars2019ILO SDMX (ILO,DF_EAR_EMTA_SEX_CUR_NB)
18India1,120 International dollars2025ILO SDMX (ILO,DF_EAR_EMTA_SEX_CUR_NB)
19Palau1,042 International dollars2023ILO SDMX (ILO,DF_EAR_EMTA_SEX_CUR_NB)
20Philippines893.0 International dollars2024ILO SDMX (ILO,DF_EAR_EMTA_SEX_CUR_NB)
21Marshall Islands804.0 International dollars2019ILO SDMX (ILO,DF_EAR_EMTA_SEX_CUR_NB)
22Cambodia788.0 International dollars2025ILO SDMX (ILO,DF_EAR_EMTA_SEX_CUR_NB)
23Laos675.0 International dollars2022ILO SDMX (ILO,DF_EAR_EMTA_SEX_CUR_NB)
24Nepal586.0 International dollars2017ILO SDMX (ILO,DF_EAR_EMTA_SEX_CUR_NB)
25Timor-Leste578.0 International dollars2021ILO SDMX (ILO,DF_EAR_EMTA_SEX_CUR_NB)
26Kiribati573.0 International dollars2023ILO SDMX (ILO,DF_EAR_EMTA_SEX_CUR_NB)
27Sri Lanka558.0 International dollars2024ILO SDMX (ILO,DF_EAR_EMTA_SEX_CUR_NB)
28Indonesia540.0 International dollars2023ILO SDMX (ILO,DF_EAR_EMTA_SEX_CUR_NB)
29Bangladesh470.0 International dollars2024ILO SDMX (ILO,DF_EAR_EMTA_SEX_CUR_NB)
30Myanmar431.0 International dollars2020ILO SDMX (ILO,DF_EAR_EMTA_SEX_CUR_NB)
31Pakistan407.0 International dollars2025ILO SDMX (ILO,DF_EAR_EMTA_SEX_CUR_NB)
32Vanuatu342.0 International dollars2010ILO SDMX (ILO,DF_EAR_EMTA_SEX_CUR_NB)

The latest year available differs by country (2005–2025). Check the Year column.

Source

  • ILO SDMX (ILO,DF_EAR_EMTA_SEX_CUR_NB) (CC BY 4.0)

On the 3D map, click a number to see the URL of the original file, the location inside it, the text exactly as written, the date fetched and the file fingerprint (sha256).

Price level ranking

26 Asia-Pacific countries and territories ranked by how expensive everyday goods are (world average = 100), highest first. The top three are Australia, New Zealand, Japan. Each number has its source (public statistics from the UN, the World Bank and others) and year.

RankCountry/territoryPrice level of everyday goods (world average =100)YearSource
1Australia177.4 2021World Bank ICP
2New Zealand156.1 2021World Bank ICP
3Japan142.8 2021World Bank ICP
4Hong Kong124.3 2021World Bank ICP
5South Korea121.1 2021World Bank ICP
6Singapore118.3 2021World Bank ICP
7China96.1 2021World Bank ICP
8Maldives92.9 2021World Bank ICP
9Taiwan82.72 2021World Bank ICP
10Fiji67.74 2021World Bank ICP
11Brunei65.01 2021World Bank ICP
12Philippines62.13 2021World Bank ICP
13Malaysia56.21 2021World Bank ICP
14Cambodia55.59 2021World Bank ICP
15Indonesia53.97 2021World Bank ICP
16Thailand53.73 2021World Bank ICP
17Bangladesh50.17 2021World Bank ICP
18Laos47.28 2021World Bank ICP
19Vietnam46.36 2021World Bank ICP
20Mongolia46.05 2021World Bank ICP
21Nepal41.89 2021World Bank ICP
22Sri Lanka41.52 2021World Bank ICP
23Myanmar40.75 2017World Bank ICP
24India40.44 2021World Bank ICP
25Bhutan40.04 2021World Bank ICP
26Pakistan39.2 2021World Bank ICP

The latest year available differs by country (2017–2021). Check the Year column.

Source

  • World Bank ICP (CC BY 4.0)

On the 3D map, click a number to see the URL of the original file, the location inside it, the text exactly as written, the date fetched and the file fingerprint (sha256).

Inflation ranking

37 Asia-Pacific countries and territories ranked by inflation (1 year), highest first. The top three are Myanmar, Bangladesh, Mongolia. Each number has its source (public statistics from the UN, the World Bank and others) and year.

RankCountry/territoryInflation (1 year)YearSource
1Myanmar27.4 %2023Asian Development Bank KIDB
2Bangladesh8.77 %2025World Bank WDI
3Mongolia8.61 %2025World Bank WDI
4Laos7.74 %2025World Bank WDI
5Marshall Islands7.47 %2023Asian Development Bank KIDB
6Kiribati5.1 %2025Asian Development Bank KIDB
7Papua New Guinea4.42 %2025World Bank WDI
8Nauru4.26 %2023Asian Development Bank KIDB
9Maldives4.01 %2025World Bank WDI
10Bhutan3.56 %2025World Bank WDI
11Pakistan3.55 %2025World Bank WDI
12Solomon Islands3.37 %2025World Bank WDI
13Vietnam3.31 %2025World Bank WDI
14Japan3.17 %2025World Bank WDI
15Tuvalu2.92 %2025Asian Development Bank KIDB
16Australia2.87 %2025World Bank WDI
17New Zealand2.84 %2025World Bank WDI
18Nepal2.65 %2025World Bank WDI
19India2.4 %2025World Bank WDI
20Cambodia2.35 %2025World Bank WDI
21Federated States of Micronesia2.22 %2025Asian Development Bank KIDB
22South Korea2.12 %2025World Bank WDI
23Indonesia1.91 %2025World Bank WDI
24Taiwan1.66 %2025Asian Development Bank KIDB
25Philippines1.66 %2025World Bank WDI
26Hong Kong1.44 %2025World Bank WDI
27Malaysia1.38 %2025World Bank WDI
28Singapore0.9 %2025World Bank WDI
29Vanuatu0.66 %2025World Bank WDI
30Timor-Leste0.43 %2025World Bank WDI
31Macau0.33 %2025World Bank WDI
32China0.06 %2025World Bank WDI
33Thailand-0.13 %2025World Bank WDI
34Brunei-0.3 %2025World Bank WDI
35Palau-0.42 %2025World Bank WDI
36Fiji-1.38 %2025World Bank WDI
37Sri Lanka-4.76 %2025World Bank WDI

The latest year available differs by country (2023–2025). Check the Year column.

Compare with care: sources differ by country (Asian Development Bank KIDB, World Bank WDI)

Source

  • Asian Development Bank KIDB (CC BY 3.0 IGO)
  • World Bank WDI (CC BY 4.0)

On the 3D map, click a number to see the URL of the original file, the location inside it, the text exactly as written, the date fetched and the file fingerprint (sha256).

Economic growth ranking

37 Asia-Pacific countries and territories ranked by economic growth (1 year), highest first. The top three are Taiwan, Vietnam, Bhutan. Each number has its source (public statistics from the UN, the World Bank and others) and year.

RankCountry/territoryEconomic growth (1 year)YearSource
1Taiwan8.68 %2025Asian Development Bank KIDB
2Vietnam8.02 %2025World Bank WDI
3Bhutan8.01 %2025World Bank WDI
4India7.57 %2025World Bank WDI
5Timor-Leste6.97 %2025World Bank WDI
6Mongolia6.84 %2025World Bank WDI
7Maldives6.31 %2025World Bank WDI
8Palau6.29 %2025World Bank WDI
9Papua New Guinea5.64 %2025World Bank WDI
10Cambodia5.35 %2025World Bank WDI
11Malaysia5.17 %2025World Bank WDI
12Indonesia5.11 %2025World Bank WDI
13Singapore5.03 %2025World Bank WDI
14China4.96 %2025World Bank WDI
15Sri Lanka4.95 %2025World Bank WDI
16Macau4.67 %2025World Bank WDI
17Laos4.54 %2025World Bank WDI
18Nepal4.43 %2025World Bank WDI
19Philippines4.4 %2025World Bank WDI
20Kiribati4.22 %2025World Bank WDI
21Pakistan3.7 %2025World Bank WDI
22Solomon Islands3.62 %2025World Bank WDI
23Bangladesh3.49 %2025World Bank WDI
24Hong Kong3.49 %2025World Bank WDI
25Fiji3.19 %2025World Bank WDI
26Vanuatu3.05 %2025World Bank WDI
27Thailand2.44 %2025World Bank WDI
28Marshall Islands2.28 %2025World Bank WDI
29Nauru2.14 %2025World Bank WDI
30Tuvalu1.64 %2025World Bank WDI
31Australia1.35 %2025World Bank WDI
32Japan1.19 %2025World Bank WDI
33Federated States of Micronesia1.06 %2025World Bank WDI
34South Korea1.01 %2025World Bank WDI
35Brunei0.67 %2025World Bank WDI
36New Zealand0.46 %2025World Bank WDI
37Myanmar-2.01 %2025World Bank WDI

Compare with care: sources differ by country (Asian Development Bank KIDB, World Bank WDI)

Source

  • Asian Development Bank KIDB (CC BY 3.0 IGO)
  • World Bank WDI (CC BY 4.0)

On the 3D map, click a number to see the URL of the original file, the location inside it, the text exactly as written, the date fetched and the file fingerprint (sha256).

Unemployment ranking

38 Asia-Pacific countries and territories ranked by unemployment rate, highest first. The top three are Nepal, Marshall Islands, Federated States of Micronesia. Each number has its source (public statistics from the UN, the World Bank and others) and year.

RankCountry/territoryUnemployment rateYearSource
1Nepal10.46 %2025World Bank WDI
2Marshall Islands9.82 %2021ILO
3Federated States of Micronesia8.86 %2014Asian Development Bank KIDB
4Tuvalu7.32 %2022ILO
5Pakistan6.96 %2025ILO
6Mongolia5.41 %2025ILO
7Brunei5.35 %2025ILO
8Fiji5.35 %2025World Bank WDI
9New Zealand5.26 %2025ILO
10China4.62 %2025World Bank WDI
11Maldives4.51 %2025World Bank WDI
12India4.51 %2025ILO
13Australia4.17 %2025ILO
14Sri Lanka4 %2025World Bank WDI
15Bangladesh3.78 %2025World Bank WDI
16Malaysia3.76 %2025World Bank WDI
17Hong Kong3.65 %2025ILO
18North Korea3.54 %2025World Bank WDI
19Bhutan3.36 %2025ILO
20Taiwan3.35 %2025Asian Development Bank KIDB
21Cambodia3.27 %2025ILO
22Singapore3.25 %2025ILO
23Indonesia3.24 %2025World Bank WDI
24Myanmar3.05 %2025World Bank WDI
25South Korea2.79 %2025ILO
26Kiribati2.79 %2023ILO
27Papua New Guinea2.57 %2025World Bank WDI
28Japan2.5 %2025ILO
29Macau2.35 %2025World Bank WDI
30Philippines2.23 %2025World Bank WDI
31Palau2.09 %2023ILO
32Timor-Leste1.59 %2025World Bank WDI
33Vietnam1.52 %2025World Bank WDI
34Solomon Islands1.43 %2025World Bank WDI
35Vanuatu1.41 %2025ILO
36Laos1.19 %2025World Bank WDI
37Nauru1 %2025Asian Development Bank KIDB
38Thailand0.6 %2025ILO

The latest year available differs by country (2014–2025). Check the Year column.

Compare with care: sources differ by country (ILO, Asian Development Bank KIDB, World Bank WDI)

Source

  • ILO (CC BY 4.0)
  • Asian Development Bank KIDB (CC BY 3.0 IGO)
  • World Bank WDI (CC BY 4.0)

On the 3D map, click a number to see the URL of the original file, the location inside it, the text exactly as written, the date fetched and the file fingerprint (sha256).

Income inequality (Gini) ranking

31 Asia-Pacific countries and territories ranked by income inequality (Gini index), highest first. The top three are Papua New Guinea, Malaysia, Federated States of Micronesia. Each number has its source (public statistics from the UN, the World Bank and others) and year.

RankCountry/territoryIncome inequality (Gini coefficient)YearSource
1Papua New Guinea41.9 2009World Bank WDI
2Malaysia40.7 2021World Bank WDI
3Federated States of Micronesia40.1 2013World Bank WDI
4Philippines39.3 2023World Bank WDI
5Tuvalu39.1 2010World Bank WDI
6Sri Lanka37.7 2019World Bank WDI
7Solomon Islands37.1 2012World Bank WDI
8Vietnam36.1 2022World Bank WDI
9China36 2022World Bank WDI
10Marshall Islands35.5 2019World Bank WDI
11Laos34.7 2024World Bank WDI
12Indonesia34.4 2025World Bank WDI
13Australia33.8 2020World Bank WDI
14Pakistan33.5 2024World Bank WDI
15Thailand33.3 2024World Bank WDI
16South Korea32.9 2021World Bank WDI
17New Zealand32.6 2022Asian Development Bank KIDB
18Nauru32.4 2012World Bank WDI
19Vanuatu32.3 2019World Bank WDI
20Japan32.3 2020World Bank WDI
21Taiwan31.57 2021Asian Development Bank KIDB
22Mongolia31.4 2022World Bank WDI
23Bangladesh30.9 2022World Bank WDI
24Myanmar30.7 2017World Bank WDI
25Fiji30.7 2019World Bank WDI
26Nepal30 2022World Bank WDI
27Maldives29.3 2019World Bank WDI
28Timor-Leste28.7 2014World Bank WDI
29Bhutan28.5 2022World Bank WDI
30India25.5 2022World Bank WDI
31Kiribati24.7 2023World Bank WDI

The latest year available differs by country (2009–2025). Check the Year column.

Compare with care: sources differ by country (Asian Development Bank KIDB, World Bank WDI)

Source

  • Asian Development Bank KIDB (CC BY 3.0 IGO)
  • World Bank WDI (CC BY 4.0)

On the 3D map, click a number to see the URL of the original file, the location inside it, the text exactly as written, the date fetched and the file fingerprint (sha256).

Internet use ranking

38 Asia-Pacific countries and territories ranked by share of people using the internet, highest first. The top three are Malaysia, South Korea, Taiwan. Each number has its source (public statistics from the UN, the World Bank and others) and year.

RankCountry/territoryShare of people using the internetYearSource
1Malaysia98 %2024UN SDG
2South Korea97.9 %2024UN SDG
3Taiwan96.7 %2024UN SDG
4Brunei96.3 %2024UN SDG
5Australia96.1 %2024UN SDG
6Hong Kong95.8 %2024UN SDG
7Singapore94.4 %2024UN SDG
8New Zealand93.5 %2024UN SDG
9China91.6 %2025UN SDG
10Bhutan91.3 %2024UN SDG
11Thailand90.9 %2024UN SDG
12Macau89.8 %2024UN SDG
13Kiribati89.4 %2024UN SDG
14Japan85.5 %2024UN SDG
15Maldives85.2 %2024UN SDG
16Mongolia85.1 %2024UN SDG
17Vietnam84.2 %2024UN SDG
18Palau83.9 %2024UN SDG
19Nauru83 %2024UN SDG
20Fiji74.7 %2024UN SDG
21Indonesia72.8 %2024UN SDG
22India70 %2025UN SDG
23Cambodia68.5 %2024UN SDG
24Philippines67.3 %2024UN SDG
25Marshall Islands65.9 %2024UN SDG
26Laos65.6 %2024UN SDG
27Myanmar58.54 %2023Asian Development Bank KIDB
28Pakistan57.3 %2024UN SDG
29Sri Lanka54.6 %2024UN SDG
30Bangladesh53.4 %2024UN SDG
31Nepal46.3 %2024UN SDG
32Federated States of Micronesia39.5 %2024UN SDG
33Tuvalu35.2 %2017UN SDG
34Timor-Leste35 %2021UN SDG
35Solomon Islands29 %2024UN SDG
36Vanuatu22.4 %2015UN SDG
37Papua New Guinea18.8 %2024UN SDG
38North Korea0 %2004World Bank WDI

The latest year available differs by country (2004–2025). Check the Year column.

Compare with care: sources differ by country (Asian Development Bank KIDB, World Bank WDI, UN SDG)

Source

  • Asian Development Bank KIDB (CC BY 3.0 IGO)
  • World Bank WDI (CC BY 4.0)
  • UN SDG (UN)

On the 3D map, click a number to see the URL of the original file, the location inside it, the text exactly as written, the date fetched and the file fingerprint (sha256).

Fixed broadband ranking

37 Asia-Pacific countries and territories ranked by fixed broadband subscriptions (per 100 people), highest first. The top three are South Korea, China, Hong Kong. Each number has its source (public statistics from the UN, the World Bank and others) and year.

RankCountry/territoryFixed broadband subscriptions, fiber etc. (per 100 people)YearSource
1South Korea47.8 items2024World Bank WDI
2China47.19 items2024World Bank WDI
3Hong Kong40.27 items2024World Bank WDI
4Japan38.63 items2023World Bank WDI
5New Zealand38.05 items2024World Bank WDI
6Australia36.48 items2024World Bank WDI
7Taiwan30.44 items2024Asian Development Bank KIDB
8Macau29.86 items2024World Bank WDI
9Singapore27.81 items2024World Bank WDI
10Vietnam23.71 items2024World Bank WDI
11Brunei21.18 items2024World Bank WDI
12Maldives19.65 items2024World Bank WDI
13Mongolia15.78 items2024World Bank WDI
14Thailand14.89 items2024World Bank WDI
15Malaysia13.55 items2024World Bank WDI
16Nepal10.07 items2024World Bank WDI
17Nauru9.96 items2022World Bank WDI
18Sri Lanka8.47 items2024World Bank WDI
19Bangladesh8.09 items2024World Bank WDI
20Palau7.33 items2023World Bank WDI
21Philippines7.14 items2024World Bank WDI
22Federated States of Micronesia5.82 items2022World Bank WDI
23Indonesia4.92 items2024World Bank WDI
24Tuvalu4.52 items2022World Bank WDI
25Cambodia4.15 items2024World Bank WDI
26India3.15 items2024World Bank WDI
27Bhutan2.92 items2024World Bank WDI
28Myanmar2.87 items2024World Bank WDI
29Laos2.72 items2023World Bank WDI
30Marshall Islands2.35 items2022World Bank WDI
31Fiji1.8 items2024World Bank WDI
32Pakistan1.47 items2024World Bank WDI
33Vanuatu1.16 items2024World Bank WDI
34Papua New Guinea0.23 items2024World Bank WDI
35Solomon Islands0.11 items2022World Bank WDI
36Kiribati0.04 items2024World Bank WDI
37Timor-Leste0.01 items2024World Bank WDI

The latest year available differs by country (2022–2024). Check the Year column.

Compare with care: sources differ by country (Asian Development Bank KIDB, World Bank WDI)

Source

  • Asian Development Bank KIDB (CC BY 3.0 IGO)
  • World Bank WDI (CC BY 4.0)

On the 3D map, click a number to see the URL of the original file, the location inside it, the text exactly as written, the date fetched and the file fingerprint (sha256).

International tourist arrivals ranking

36 Asia-Pacific countries and territories ranked by tourists arriving from abroad (1 year), highest first. The top three are Japan, Thailand, Malaysia. Each number has its source (public statistics from the UN, the World Bank and others) and year.

RankCountry/territoryInternational visitors (year)YearSource
1Japan36.87 million people2024Asian Development Bank KIDB
2Thailand32.97 million people2025Asian Development Bank KIDB
3Malaysia26.61 million people2025Asian Development Bank KIDB
4Hong Kong23.19 million people2025Asian Development Bank KIDB
5Vietnam21.17 million people2025Asian Development Bank KIDB
6South Korea18.94 million people2025Asian Development Bank KIDB
7Indonesia13.60 million people2024Asian Development Bank KIDB
8Singapore12.43 million people2025Asian Development Bank KIDB
9India9.82 million people2024Asian Development Bank KIDB
10Taiwan8.57 million people2025Asian Development Bank KIDB
11Australia8.27 million people2024Asian Development Bank KIDB
12Philippines5.95 million people2024Asian Development Bank KIDB
13Macau5.90 million people2020World Bank WDI
14China5.66 million people2021Asian Development Bank KIDB
15Cambodia5.57 million people2025Asian Development Bank KIDB
16Laos3.94 million people2024Asian Development Bank KIDB
17New Zealand3.18 million people2024Asian Development Bank KIDB
18Sri Lanka2.36 million people2025Asian Development Bank KIDB
19Maldives2.25 million people2025Asian Development Bank KIDB
20Pakistan2.21 million people2023Asian Development Bank KIDB
21Nepal1.16 million people2025Asian Development Bank KIDB
22Fiji986,000 people2025Asian Development Bank KIDB
23Myanmar973,000 people2025Asian Development Bank KIDB
24Mongolia847,000 people2025Asian Development Bank KIDB
25Brunei287,000 people2025Asian Development Bank KIDB
26Bhutan189,000 people2025Asian Development Bank KIDB
27Bangladesh135,000 people2021Asian Development Bank KIDB
28Papua New Guinea99,000 people2024Asian Development Bank KIDB
29Timor-Leste97,000 people2024Asian Development Bank KIDB
30Vanuatu96,000 people2025Asian Development Bank KIDB
31Palau72,000 people2025Asian Development Bank KIDB
32Solomon Islands28,500 people2025Asian Development Bank KIDB
33Kiribati8,200 people2023Asian Development Bank KIDB
34Marshall Islands6,050 people2023Asian Development Bank KIDB
35Tuvalu3,000 people2023Asian Development Bank KIDB
36Federated States of Micronesia2,000 people2023Asian Development Bank KIDB

The latest year available differs by country (2020–2025). Check the Year column.

Compare with care: sources differ by country (Asian Development Bank KIDB, World Bank WDI)

Source

  • Asian Development Bank KIDB (CC BY 3.0 IGO)
  • World Bank WDI (CC BY 4.0)

On the 3D map, click a number to see the URL of the original file, the location inside it, the text exactly as written, the date fetched and the file fingerprint (sha256).

Consumer market size ranking

26 Asia-Pacific countries and territories ranked by total household consumption (whole country, 1 year, US$), highest first. The top three are China, Japan, India. Each number has its source (public statistics from the UN, the World Bank and others) and year.

RankCountry/territoryMarket size: total household consumption (whole country, per 1 year, US dollars)YearSource
1China6.88 trillion US dollars2021Calculated only from public tables in the warehouse's clean
2Japan2.68 trillion US dollars2021Calculated only from public tables in the warehouse's clean
3India1.94 trillion US dollars2021Calculated only from public tables in the warehouse's clean
4South Korea837.38 billion US dollars2021Calculated only from public tables in the warehouse's clean
5Australia824.98 billion US dollars2021Calculated only from public tables in the warehouse's clean
6Indonesia669.91 billion US dollars2021Calculated only from public tables in the warehouse's clean
7Taiwan347.69 billion US dollars2021Calculated only from public tables in the warehouse's clean
8Pakistan339.76 billion US dollars2021Calculated only from public tables in the warehouse's clean
9Philippines304.40 billion US dollars2021Calculated only from public tables in the warehouse's clean
10Bangladesh299.20 billion US dollars2021Calculated only from public tables in the warehouse's clean
11Thailand274.75 billion US dollars2021Calculated only from public tables in the warehouse's clean
12Hong Kong241.99 billion US dollars2021Calculated only from public tables in the warehouse's clean
13Malaysia227.98 billion US dollars2021Calculated only from public tables in the warehouse's clean
14Vietnam201.87 billion US dollars2021Calculated only from public tables in the warehouse's clean
15New Zealand143.14 billion US dollars2021Calculated only from public tables in the warehouse's clean
16Singapore128.19 billion US dollars2021Calculated only from public tables in the warehouse's clean
17Sri Lanka55.49 billion US dollars2021Calculated only from public tables in the warehouse's clean
18Myanmar35.27 billion US dollars2017Calculated only from public tables in the warehouse's clean
19Nepal32.45 billion US dollars2021Calculated only from public tables in the warehouse's clean
20Cambodia18.17 billion US dollars2021Calculated only from public tables in the warehouse's clean
21Laos9.11 billion US dollars2021Calculated only from public tables in the warehouse's clean
22Mongolia8.24 billion US dollars2021Calculated only from public tables in the warehouse's clean
23Fiji3.62 billion US dollars2021Calculated only from public tables in the warehouse's clean
24Brunei3.57 billion US dollars2021Calculated only from public tables in the warehouse's clean
25Maldives2.25 billion US dollars2021Calculated only from public tables in the warehouse's clean
26Bhutan1.48 billion US dollars2021Calculated only from public tables in the warehouse's clean

The latest year available differs by country (2017–2021). Check the Year column.

Source

  • Calculated only from public tables in the warehouse's clean (national household surveys, census household counts, World Bank ICP 2021, UN WPP 2024 population, World Bank WDI exchange rates and rural/urban population, and national retail and food-service sales statistics). Nothing new was fetched

On the 3D map, click a number to see the URL of the original file, the location inside it, the text exactly as written, the date fetched and the file fingerprint (sha256).

Rice consumption ranking

35 Asia-Pacific countries and territories ranked by rice eaten per person per year, highest first. The top three are Myanmar, Cambodia, Bangladesh. Each number has its source (public statistics from the UN, the World Bank and others) and year.

RankCountry/territoryRice consumption (per 1 person per 1 year)YearSource
1Myanmar271.4 kg2023FAO Food Balance Sheets
2Cambodia262.6 kg2023FAO Food Balance Sheets
3Bangladesh250.6 kg2023FAO Food Balance Sheets
4Laos224.8 kg2023FAO Food Balance Sheets
5Vietnam219.9 kg2023FAO Food Balance Sheets
6Philippines200.4 kg2023FAO Food Balance Sheets
7Indonesia186.1 kg2023FAO Food Balance Sheets
8Sri Lanka184.4 kg2023FAO Food Balance Sheets
9Timor-Leste181.1 kg2023FAO Food Balance Sheets
10Thailand172.5 kg2023FAO Food Balance Sheets
11Bhutan172.4 kg2023FAO Food Balance Sheets
12Nepal135.4 kg2023FAO Food Balance Sheets
13China130.1 kg2023FAO Food Balance Sheets
14Malaysia117.8 kg2023FAO Food Balance Sheets
15India101.1 kg2023FAO Food Balance Sheets
16North Korea96.2 kg2018FAO Food Balance Sheets
17Vanuatu95 kg2023FAO Food Balance Sheets
18Solomon Islands89.7 kg2023FAO Food Balance Sheets
19Tuvalu86.4 kg2023FAO Food Balance Sheets
20South Korea80.9 kg2023FAO Food Balance Sheets
21Kiribati67.2 kg2023FAO Food Balance Sheets
22Taiwan61 kg2023FAO Food Balance Sheets
23Japan59.8 kg2024Ministry of Agriculture, Forestry and Fisheries Food Balance Sheet
24Papua New Guinea59.7 kg2023FAO Food Balance Sheets
25Fiji58.8 kg2023FAO Food Balance Sheets
26Marshall Islands55 kg2023FAO Food Balance Sheets
27Hong Kong51.4 kg2023FAO Food Balance Sheets
28Maldives51.4 kg2023FAO Food Balance Sheets
29Federated States of Micronesia44.8 kg2023FAO Food Balance Sheets
30Macau42.4 kg2023FAO Food Balance Sheets
31Nauru41.5 kg2023FAO Food Balance Sheets
32Mongolia23 kg2023FAO Food Balance Sheets
33New Zealand16.2 kg2023FAO Food Balance Sheets
34Australia14.4 kg2023FAO Food Balance Sheets
35Pakistan9.9 kg2023FAO Food Balance Sheets

The latest year available differs by country (2018–2024). Check the Year column.

Source

  • FAO Food Balance Sheets (Japan is not in FAO, so this uses gross food supply from the MAFF Food Balance Sheet; the counting method differs slightly, so the value is approximate) (CC BY 4.0)
  • Ministry of Agriculture, Forestry and Fisheries Food Balance Sheet (e-Stat 's File) (Government Standard Terms of Use (with attribution))

On the 3D map, click a number to see the URL of the original file, the location inside it, the text exactly as written, the date fetched and the file fingerprint (sha256).

Beer consumption ranking

34 Asia-Pacific countries and territories ranked by beer drunk per person per year, highest first. The top three are Cambodia, Australia, New Zealand. Each number has its source (public statistics from the UN, the World Bank and others) and year.

RankCountry/territoryBeer consumption (per 1 person per 1 year)YearSource
1Cambodia80.7 kg2023FAO Food Balance Sheets
2Australia70.7 kg2023FAO Food Balance Sheets
3New Zealand58.8 kg2023FAO Food Balance Sheets
4Bhutan56.5 kg2023FAO Food Balance Sheets
5Mongolia39.7 kg2023FAO Food Balance Sheets
6South Korea32.8 kg2023FAO Food Balance Sheets
7Taiwan32.4 kg2023FAO Food Balance Sheets
8Vietnam30.3 kg2023FAO Food Balance Sheets
9Thailand28.1 kg2023FAO Food Balance Sheets
10China23.7 kg2023FAO Food Balance Sheets
11Hong Kong20 kg2023FAO Food Balance Sheets
12Tuvalu19.4 kg2023FAO Food Balance Sheets
13Macau17.7 kg2023FAO Food Balance Sheets
14Fiji16.4 kg2023FAO Food Balance Sheets
15Philippines14.5 kg2023FAO Food Balance Sheets
16Marshall Islands12.9 kg2023FAO Food Balance Sheets
17Federated States of Micronesia11.9 kg2023FAO Food Balance Sheets
18Kiribati11.9 kg2023FAO Food Balance Sheets
19Nauru9.8 kg2023FAO Food Balance Sheets
20Solomon Islands8.3 kg2023FAO Food Balance Sheets
21Laos7.9 kg2023FAO Food Balance Sheets
22Papua New Guinea6.8 kg2023FAO Food Balance Sheets
23Nepal6 kg2023FAO Food Balance Sheets
24Maldives5.7 kg2023FAO Food Balance Sheets
25Sri Lanka5.3 kg2023FAO Food Balance Sheets
26Malaysia4.2 kg2023FAO Food Balance Sheets
27Timor-Leste3.9 kg2023FAO Food Balance Sheets
28Myanmar2.9 kg2023FAO Food Balance Sheets
29Vanuatu2.4 kg2023FAO Food Balance Sheets
30India2 kg2023FAO Food Balance Sheets
31North Korea1.7 kg2018FAO Food Balance Sheets
32Indonesia1.2 kg2023FAO Food Balance Sheets
33Bangladesh0 kg2023FAO Food Balance Sheets
34Pakistan0 kg2023FAO Food Balance Sheets

The latest year available differs by country (2018–2023). Check the Year column.

Source

  • FAO Food Balance Sheets (CC BY 4.0)

On the 3D map, click a number to see the URL of the original file, the location inside it, the text exactly as written, the date fetched and the file fingerprint (sha256).

Coffee consumption ranking

34 Asia-Pacific countries and territories ranked by coffee drunk per person per year, highest first. The top three are Hong Kong, Marshall Islands, Laos. Each number has its source (public statistics from the UN, the World Bank and others) and year.

RankCountry/territoryCoffee consumed (per 1 person per 1 year)YearSource
1Hong Kong43.2 kg2023FAO Food Balance Sheets
2Marshall Islands23.3 kg2023FAO Food Balance Sheets
3Laos22.6 kg2023FAO Food Balance Sheets
4Maldives20.7 kg2023FAO Food Balance Sheets
5Macau16.8 kg2023FAO Food Balance Sheets
6New Zealand12.8 kg2023FAO Food Balance Sheets
7Timor-Leste12.6 kg2023FAO Food Balance Sheets
8Solomon Islands11.6 kg2023FAO Food Balance Sheets
9Fiji7.7 kg2023FAO Food Balance Sheets
10Australia5.9 kg2023FAO Food Balance Sheets
11Vanuatu4.3 kg2023FAO Food Balance Sheets
12Philippines4.3 kg2023FAO Food Balance Sheets
13Vietnam3.9 kg2023FAO Food Balance Sheets
14Papua New Guinea3.6 kg2023FAO Food Balance Sheets
15Federated States of Micronesia3.1 kg2023FAO Food Balance Sheets
16Mongolia3 kg2023FAO Food Balance Sheets
17Tuvalu2.8 kg2023FAO Food Balance Sheets
18South Korea2.6 kg2023FAO Food Balance Sheets
19Cambodia2 kg2023FAO Food Balance Sheets
20Taiwan1.9 kg2023FAO Food Balance Sheets
21Bhutan1.3 kg2023FAO Food Balance Sheets
22Nauru1.2 kg2023FAO Food Balance Sheets
23Thailand0.7 kg2023FAO Food Balance Sheets
24Myanmar0.5 kg2023FAO Food Balance Sheets
25North Korea0.4 kg2018FAO Food Balance Sheets
26Indonesia0.3 kg2023FAO Food Balance Sheets
27China0.2 kg2023FAO Food Balance Sheets
28Sri Lanka0.2 kg2023FAO Food Balance Sheets
29Kiribati0.2 kg2023FAO Food Balance Sheets
30Nepal0.1 kg2023FAO Food Balance Sheets
31Malaysia0 kg2023FAO Food Balance Sheets
32Pakistan0 kg2023FAO Food Balance Sheets
33Bangladesh0 kg2023FAO Food Balance Sheets
34India0 kg2023FAO Food Balance Sheets

The latest year available differs by country (2018–2023). Check the Year column.

Source

  • FAO Food Balance Sheets (CC BY 4.0)

On the 3D map, click a number to see the URL of the original file, the location inside it, the text exactly as written, the date fetched and the file fingerprint (sha256).

Obesity rate ranking

35 Asia-Pacific countries and territories ranked by share of adults with obesity, highest first. The top three are Nauru, Tuvalu, Federated States of Micronesia. Each number has its source (public statistics from the UN, the World Bank and others) and year.

RankCountry/territoryShare of adults with obesityYearSource
1Nauru71.4 %2024World Health Organization
2Tuvalu65.1 %2024World Health Organization
3Federated States of Micronesia48.6 %2024World Health Organization
4Kiribati45.6 %2024World Health Organization
5Marshall Islands42 %2024World Health Organization
6Palau40.5 %2024World Health Organization
7Fiji39 %2024World Health Organization
8Brunei37.1 %2024World Health Organization
9New Zealand34 %2024World Health Organization
10Australia30.6 %2024World Health Organization
11Papua New Guinea28 %2024World Health Organization
12Mongolia25.1 %2024World Health Organization
13Pakistan24.5 %2024World Health Organization
14Malaysia23.3 %2024World Health Organization
15Vanuatu22.6 %2024World Health Organization
16Solomon Islands21.8 %2024World Health Organization
17Maldives17.9 %2024World Health Organization
18Singapore17 %2024World Health Organization
19Thailand16.4 %2024World Health Organization
20Bhutan13.1 %2024World Health Organization
21North Korea12 %2024World Health Organization
22Indonesia11.8 %2024World Health Organization
23Sri Lanka11.2 %2024World Health Organization
24Philippines9.6 %2024World Health Organization
25China9.3 %2024World Health Organization
26Laos9.2 %2024World Health Organization
27South Korea8.4 %2024World Health Organization
28Myanmar8.1 %2024World Health Organization
29India8 %2024World Health Organization
30Nepal8 %2024World Health Organization
31Japan5.9 %2024World Health Organization
32Bangladesh5.8 %2024World Health Organization
33Cambodia4.9 %2024World Health Organization
34Timor-Leste3.6 %2024World Health Organization
35Vietnam2.4 %2024World Health Organization

Source

  • World Health Organization (CC BY-NC-SA 3.0 IGO (check restrictions on commercial use))

On the 3D map, click a number to see the URL of the original file, the location inside it, the text exactly as written, the date fetched and the file fingerprint (sha256).

Smoking rate ranking

34 Asia-Pacific countries and territories ranked by share of people who smoke, highest first. The top three are Timor-Leste, Myanmar, Solomon Islands. Each number has its source (public statistics from the UN, the World Bank and others) and year.

RankCountry/territorySmoking rateYearSource
1Timor-Leste49.7 %2030World Health Organization
2Myanmar39.7 %2030World Health Organization
3Solomon Islands37.8 %2030World Health Organization
4Papua New Guinea36.9 %2030World Health Organization
5Kiribati32.8 %2030World Health Organization
6Marshall Islands30.7 %2030World Health Organization
7Tuvalu30.7 %2030World Health Organization
8Indonesia30.6 %2030World Health Organization
9Nauru30 %2030World Health Organization
10Mongolia28.9 %2030World Health Organization
11Bangladesh28.5 %2030World Health Organization
12Vanuatu24.8 %2030World Health Organization
13Nepal24.5 %2030World Health Organization
14Fiji23.9 %2030World Health Organization
15Maldives23 %2030World Health Organization
16China21.9 %2030World Health Organization
17Palau21.7 %2030World Health Organization
18Laos21.6 %2030World Health Organization
19Sri Lanka19.4 %2030World Health Organization
20Vietnam19.3 %2030World Health Organization
21India18.3 %2030World Health Organization
22Bhutan18.2 %2030World Health Organization
23Philippines17.5 %2030World Health Organization
24Thailand16.1 %2030World Health Organization
25South Korea15.9 %2030World Health Organization
26Cambodia15.7 %2030World Health Organization
27Malaysia15.2 %2030World Health Organization
28Pakistan14.9 %2030World Health Organization
29Japan14.9 %2030World Health Organization
30Brunei13.7 %2030World Health Organization
31North Korea13.3 %2030World Health Organization
32Singapore13.1 %2030World Health Organization
33Australia9.6 %2030World Health Organization
34New Zealand7 %2030World Health Organization

Source

  • World Health Organization (CC BY-NC-SA 3.0 IGO (check restrictions on commercial use))

On the 3D map, click a number to see the URL of the original file, the location inside it, the text exactly as written, the date fetched and the file fingerprint (sha256).

05

Sources, methods and terms of use

Sources, methods and terms of use

The data comes from public statistics released by national statistical offices and international organizations. Check the year, source and terms before using a figure. No individual personal records are included.

The database structure and explanatory text are CC BY 4.0. Individual figures remain subject to their source terms. WHO data on alcohol, smoking and obesity cannot be used commercially (CC BY-NC-SA 3.0 IGO).

Terms of use and citation

The database structure and explanatory text are CC BY 4.0. Individual figures remain subject to their source terms. WHO data on alcohol, smoking and obesity cannot be used commercially (CC BY-NC-SA 3.0 IGO).

How to cite
APAC Open Marketing Database (aTELiER FACTORY), version 2026-10-12. https://atelierfactory.jp/data/asia/

However, figures from the World Health Organization (WHO), such as alcohol, tobacco and obesity, may not be used for commercial purposes (CC BY-NC-SA 3.0 IGO). If you reuse them, share them under the same terms.

How the data is compiled

  1. We download files published by national statistics offices and international organizations. Each file is kept unchanged, with its URL, retrieval date and SHA-256 fingerprint recorded.
  2. Country and category names are mapped to international codes (ISO3 for countries, COICOP for spending, and so on).
  3. Review source terms and record which data is included or excluded. State restrictions for any included data whose use is limited.
  4. Where several organizations publish the same figure, we pick one by a fixed priority and keep the others with their differences.
  5. For the numbers shown in Asia Diorama, we reopen the original files and check that the recorded location contains exactly the same text.

Included sources (72)

SourceCountryLicence
wballCC BY 4.0
icpallCC BY 4.0
worldbank_icp2021allCC BY 4.0
findexallCC BY 4.0
wppallCC BY 3.0 IGO
UN Household Size and CompositionallCC BY 3.0 IGO
sdgallUN terms (reuse allowed with attribution)
iloallCC BY 4.0
adballCC BY 3.0 IGO
oecdallOECD terms (commercial use allowed with attribution)
oecd_na_coicop1999allOECD terms (commercial use allowed with attribution)
oecd_na_coicop2018allOECD terms (commercial use allowed with attribution)
oecd_regionsallOECD terms (commercial use allowed with attribution)
derivedallFollows the terms of its inputs
dhsallDHS API terms (attribution required)
wikipediaallCC0
estat_kakeiallJapanese Government Standard Terms of Use v2.0
eurostat_hbsallCC BY 4.0
nso_sesallOpen Government Licence Thailand
nso_thaallOpen Government Licence Thailand
pdh_hiesallCC BY 4.0
psa_fiesallPSA terms (reuse allowed with attribution)
singstat_hesallSingapore Open Data Licence
censusallPublic domain
dosmallCC BY 4.0
onsallOpen Government Licence v3.0
hdx_codpsallCC BY-IGO (CC BY for Myanmar)
hdx_cod_psallCC BY-IGO (CC BY for Myanmar)
ghsl_ucdballCC BY 4.0
overture_placesallCDLA Permissive 2.0
abs_retail_hsiallCC BY 4.0
aus_abs_erp_state_age_sexallCC BY 4.0
aus_abs_hes2016_state_expenditureallCC BY 4.0
brn_deps_population_districtallDEPS terms (use allowed with attribution)
csd_retail_salesallDATA.GOV.HK terms (commercial use allowed with attribution)
dosm_hes2024allCC BY 4.0
dosm_iowrt_3dallCC BY 4.0
dosm_population_stateallCC BY 4.0
estat_census2025allJapanese Government Standard Terms of Use v2.0
estat_dashboardallJapanese Government Standard Terms of Use v2.0
estat_economic_census_2021allJapanese Government Standard Terms of Use v2.0
estat_kakei_annual_total_singleallJapanese Government Standard Terms of Use v2.0
estat_population_estimates_2024allJapanese Government Standard Terms of Use v2.0
hkg_csd_lbnp_districtallDATA.GOV.HK terms (commercial use allowed with attribution)
ind_fill_mospi_hcesallGovernment Open Data License - India
jpn_nfis2019_pref_expenditureallJapanese Government Standard Terms of Use v2.0
kor_mois_resident_register_dongallKorea Public Data Portal: no restriction on permitted use
mdv_mbs_projection_atollallFree to reproduce with attribution (stated in the report)
mng_nso_population_aimagallCC BY 4.0
nso_population_by_age_sex_province_monthlyallOpen Government Licence Thailand
nso_ses_avg_monthly_expenditure_2024allOpen Government Licence Thailand
nso_ses_os_22allOpen Government Licence Thailand
nzl_statsnz_hes2023_region_expenditureallCC BY 4.0
nzl_statsnz_subnational_2025allCC BY 4.0
ons_family_spending_workbook1allOpen Government Licence v3.0
pak_census2023_age_sex_provinceallPBS terms (commercial use allowed with attribution)
pak_pbs_hies2025_province_expenditureallPBS terms (commercial use allowed with attribution)
pdh_df_hhexpallCC BY 4.0
pdh_hhcounts_subnationalallCC BY 4.0
pdh_hies_income_regionallCC BY 4.0
phl_popcen2024_provinceallPSA terms (reuse allowed with attribution)
psa_aspbi_2022allPSA terms (reuse allowed with attribution)
psa_fies2023_t1_income_expenditure_regionallPSA terms (reuse allowed with attribution)
psa_fies2023_t7_expenditure_by_group_decileallPSA terms (reuse allowed with attribution)
sgp_singstat_resident_region_age_sexallSingapore Open Data Licence
singstat_D10072_multi_dimensional_data_cube_monthly_household_expenditure_aallSingapore Open Data Licence
singstat_M601481_fullallSingapore Open Data Licence
singstat_M602171_retail_sales_value_based_on_2025_100_index_estimated_monthlyallSingapore Open Data Licence
singstat_M602181_value_of_food_beverage_sales_based_on_2025_100_index_estimatallSingapore Open Data Licence
twn_dgbas_fies2025_county_expenditureallOpen Government Data License, version 1.0 (Taiwan; commercial use allowed with attribution)
twn_ris_county_age_monthlyallOpen Government Data License, version 1.0 (Taiwan; commercial use allowed with attribution)
usa_fill_census_martsallPublic domain

Excluded data (29)

The following list records excluded data, the reason and row count. It includes data with unclear terms and data outside this distribution.

TableSourceDecisionRows
city_panelookla_speedtestexcluded (licence forbids)162,992
market_size_retaildsec_retailexcluded (licence unclear)26
market_size_retailnso_trade_turnoverexcluded (licence unclear)9
region_household_spendingbrn_deps_hes2024_district_expenditureexcluded (licence unclear)4
region_household_spendingbtn_blss2022_expenditure_dzongkhagexcluded (licence unclear)60
region_household_spendingchn_nbs_yb2021_consumption_provinceexcluded (licence unclear)279
region_household_spendingkhm_nis_cses2023_zone_expenditureexcluded (licence unclear)12
region_household_spendinglka_hies2019_expenditure_provinceexcluded (licence unclear)144
region_household_spendingmng_nso_hses_region_expenditureexcluded (licence unclear)6
region_household_spendingnpl_nso_nlss4_province_expenditureexcluded (licence unclear)35
region_panelhdx_codpsexcluded (licence forbids)548
region_population_agehdx_codpsexcluded (licence forbids)26,852
region_population_latestchn_census2020_provinceexcluded (licence unclear)775
region_population_latestfsm_census2023_stateexcluded (licence unclear)80
region_population_latesthdx_cod_psexcluded (licence forbids)578
region_population_latestidn_kemkes_profil2025_provinceexcluded (licence unclear)114
region_population_latestind_tgpp_projection_stateexcluded (licence unclear)507
region_population_latestlka_census2024_districtexcluded (licence unclear)125
region_population_latestlka_dcs_midyear_districtexcluded (licence unclear)75
region_population_latestmmr_census2024_stateexcluded (licence unclear)437
region_population_latestnpl_nso_projection_provinceexcluded (licence unclear)315
region_population_latestpak_planning_projection_provinceexcluded (licence unclear)15
region_population_latestplw_bbp_census2020_stateexcluded (licence unclear)16
region_population_latestpng_census2024_provinceexcluded (licence unclear)66
region_population_latestprk_census2008_provinceexcluded (licence unclear)171
region_population_latestslb_census2019_provinceexcluded (licence unclear)220
region_population_latestvnm_nso_pxweb_population_provinceexcluded (licence unclear)189
region_population_latestvut_census2020_provinceexcluded (licence unclear)152
regionshdx_codpsexcluded (licence forbids)548

All 24 tables

TableRowsDescription
countries49iso3, name_ja, name_en, region_ja, is_core, in_apac, un_m49, wb_code, adb_code, income_group, capital
indicators53id, name_ja, explain_ja, unit, kind, source_priority, caution
country_panel131,872iso3, year, indicator, value, source, source_code, name_ja
country_panel_all_sources187,780iso3, year, indicator, value, source, source_code, name_ja
country_latest2,299iso3, name_ja, indicator, indicator_ja, year, value, unit, source, source_code, is_projection
source_agreement58indicator, source_a, source_b, pairs, how_far, median_ratio_a_over_b, verdict
population_age108,720iso3, name_ja, year, age_band, pop_total, pop_male, pop_female, is_projection
spending_structure3,648iso3, year, source, basis, coicop, coicop_ja, group6, share_pct, amount, currency, note, name_ja
spending_group61,842iso3, name_ja, year, source, basis, group6, share_pct
regions7,724iso3, level, region_code, region_name, parent_name, level_name_local, source, country_ja
region_population_age557,631iso3, level, region_code, year, sex, age_band, population, source
region_panel26,473iso3, level, region_code, year, source, pop_total, pop_0_14_pct, pop_15_34_pct, pop_35_64_pct, pop_65p_pct, region_name, parent_name, country_ja
category_master57category_id, category_ja, group_ja, icp_series, dhs_indicators, findex_series, wiki_articles
category_involvement32,033iso3, category_id, measure, year, value, source, breakdown, note, category_ja, group_ja, country_ja
category_involvement_latest4,101iso3, category_id, measure, year, value, source, breakdown, note, category_ja, group_ja, country_ja
category_interest_monthly93,336lang, category_id, yyyymm, views, vpm
language_market_map26lang, market, lang_ja
cities11,422city_id, city_name, city_names_all, country_name, area_km2, pop_2025, income_group_wb, world_region, is_capital, iso3, lon, lat, in_apac, country_ja, pop_2030, pop_2015, pop_growth_2015_2025_pct, gdp_ppp_per_capita, hdi, pop_young_pct, pop_older_pct, places_total, source
city_panel889,315city_id, year, indicator, value, iso3, city_name, source
region_population_latest27,692iso3, adm1_id, measure, sign, source_dataset, level, region_name_source, age_group, sex, value, unit, src_file, src_loc, src_value, source
region_household_spending4,748iso3, adm1_id, adm1_name, region_name_source, match_how, survey, year, area, household_type, measure, currency, price_basis, group_level, group_code, group_codes_covered, group_match, group_name_coicop, group_name_source, value, share_pct, share_basis, total_value, comparable_across_countries, comparability_note, source_dataset, src_file, src_loc, src_value, note, source
market_size_household9,679layer, iso3, year, period_label, survey, source_dataset, source_table, household_scope, item_code, item_name, item_level, item_path, coicop2018_code, coicop2018_name_ja, coicop2018_match, value_lc, currency, value_usd, fx_lc_per_usd, formula, inputs, input_years, year_gap_note, comparable_across_countries, approx, approx_reason, note, source
market_size_icp1,860layer, iso3, year, icp_series, icp_series_name, scope, coicop2018_code, coicop2018_name_ja, coicop2018_match, value_ppp_intl_usd, value_usd, value_lc_icp_published, currency, population_used, formula, inputs, input_years, year_gap_note, comparable_across_countries, approx, approx_reason, note, source
market_size_retail1,139layer, iso3, year, source_dataset, measure, classification, industry_code, industry_name, isic4_code, isic4_match, sector, value_lc, currency, value_usd, fx_lc_per_usd, periods_summed, formula, inputs, input_years, year_gap_note, comparable_across_countries, approx, approx_reason, note, source

Metadata for programs and AI

06

3D map

3D map

Explore part of this database as a 3D map of 38 Asia-Pacific countries and territories. Height shows quantities and colour shows shares. Select a figure to inspect its original source.

Preview image of the Asia Diorama 3D map
Open a larger view